

Photo: Invest Guyana
The directors of an illustrative Guyanese agro-processing company are reviewing a proposed packaging line. The investment paper says the project has a payback period of 3.47 years, an internal rate of return of 17.7% and a net present value of G$16.9 million.
One director asks the obvious question: if all three figures measure the return, why are they different?
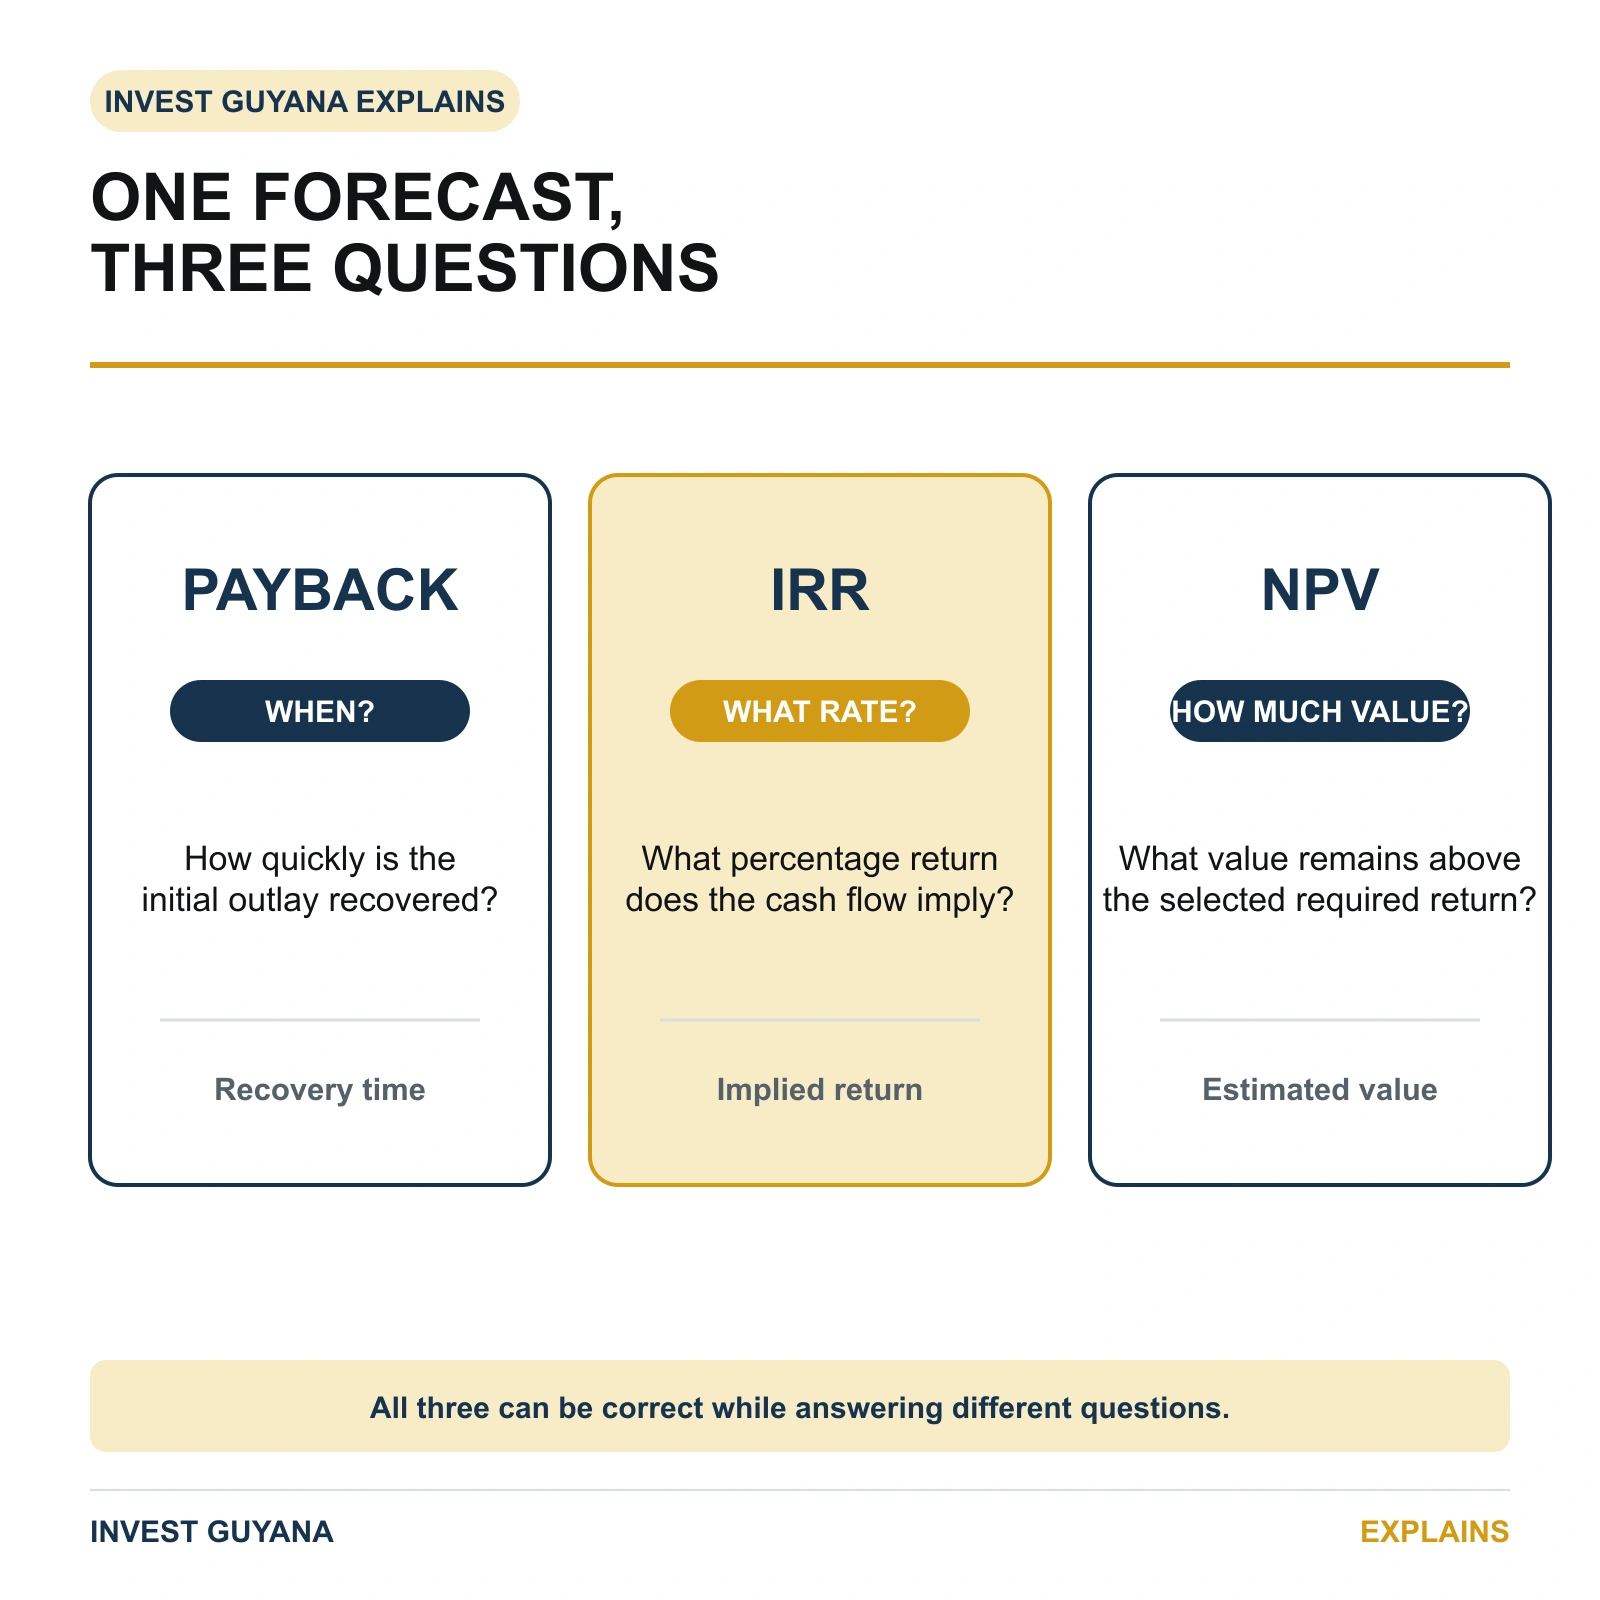
They are different because they do not measure the same thing. Payback asks how quickly the original cash investment is recovered. Internal rate of return, or IRR, expresses the return implied by the projected cash flows as a percentage. Net present value, or NPV, estimates how much value remains after allowing for the required return represented by a chosen discount rate.
All three can be calculated correctly from the same forecast and still lead managers to focus on different aspects of the decision.
Consider this purely illustrative project cash-flow stream, shown in G$ millions:
| Year | Incremental project cash flow |
|---|---|
| 0 | -100 |
| 1 | 20 |
| 2 | 28 |
| 3 | 34 |
| 4 | 38 |
| 5 | 50 |
The year-five amount includes an illustrative terminal recovery. The cash flows are assumed to be after tax and working-capital effects but before debt financing. The 12% discount rate used below is also illustrative; it is not a prescribed Guyana rate or a recommendation for any project.
One cash-flow stream, three questions
Investment appraisal begins with cash flows, not with the metric selected to summarise them. If the forecast omits a construction overrun, customer delay, working-capital requirement or tax payment, every return figure built from that forecast can be precisely calculated and commercially misleading.
The methods then interpret those cash flows differently. The World Bank’s project-appraisal guidance describes NPV and IRR as related discounted-cash-flow techniques, while ACCA’s investment-appraisal guidance separately identifies payback as a recovery measure.
The difference is not a defect. The problem begins when a metric is used to answer a question it was not designed to answer.
Payback is a recovery clock
Simple payback follows the cumulative undiscounted cash flow until the initial investment has been recovered.
In the example, G$82 million has been recovered by the end of year three, leaving G$18 million outstanding. Year four produces G$38 million. Dividing the remaining G$18 million by that year’s G$38 million gives approximately 0.47 of a year, producing a simple payback period of 3.47 years. That fractional result assumes the year-four cash flow accrues evenly through the year; where actual timing is uneven, management should model shorter periods or state only that recovery occurs during year four.
That figure can help management think about liquidity, exposure to technological change and how long capital remains at risk. A business with tight cash resources may reasonably care whether an investment begins returning cash in three years or seven.
But simple payback ignores the time value of money and every cash flow after the recovery point. A project that produces substantial cash for ten years after payback can appear identical to one that stops generating cash immediately afterwards. Discounted payback corrects the first weakness by discounting the cash flows, but it still stops counting once the investment is recovered.
Payback is therefore useful as a risk and liquidity indicator. It is not, by itself, a measure of total value or profitability.
NPV asks how much value remains
Money expected in the future is not normally treated as equivalent to the same nominal amount available today. NPV discounts each expected cash flow back to its present value and then adds those present values, including the initial outlay:
NPV = Σ CFt ÷ (1 + r)^t
Here, CFt is the cash flow in period t, and r is the discount rate appropriate to the cash flow being valued.
Using the illustrative cash flows and a 12% rate produces an NPV of approximately positive G$16.9 million. In this simplified case, that means the project’s discounted cash inflows exceed the G$100 million investment by G$16.9 million after allowing for the 12% required return embedded in the calculation.
NPV is expressed in money, which helps decision-makers see the estimated amount of value created rather than only a percentage. It also includes cash flows across the entire forecast period.
The result depends heavily on the forecast and discount rate. At an illustrative 8%, the same project has an NPV of about G$31.5 million. At 16%, it falls to approximately G$4.6 million. NPV does not prove that the cash will arrive, and a positive result is not the same as cash available to pay a bill today.
IRR asks what rate the cash flows imply
IRR is the discount rate that would make the project’s NPV equal zero. For the illustrative packaging line, that rate is approximately 17.7%.
A percentage is often easier to communicate than an absolute currency amount. If the project’s required return were properly established below 17.7%, these conventional cash flows would also produce a positive NPV. If the required return were above the IRR, the NPV would be negative.
The comparison still requires care. A project IRR calculated from cash flows before financing is not the same as an equity IRR calculated from the investors’ contributions and distributions after debt flows. Changing the capital structure can change the equity IRR without changing the operating project.
IRR can also be misleading when projects differ in scale or timing. A smaller investment can produce a higher percentage return but create less total value than a larger alternative. Cash-flow streams that change sign several times can generate more than one mathematical IRR or no useful solution. Institutional guidance also notes the reinvestment assumption embedded in conventional IRR calculations.
For those reasons, IRR should be read beside NPV and the underlying cash-flow pattern, not used as a self-contained verdict.
The discount rate is a decision input
NPV requires management to choose a discount rate. That rate should be consistent with the currency, risk and type of cash flow being assessed.
Nominal cash flows that include inflation require a nominal rate. Real cash flows that exclude general inflation require a real rate. Project cash flow and equity cash flow also require different return concepts. A bank lending rate, government bond yield or published prime rate is therefore not automatically the correct project discount rate.
Risk also matters. Construction uncertainty, customer concentration, foreign-currency exposure, regulation, operating experience and the reliability of contracts can affect the return investors require. The World Bank guidance describes estimating an appropriate required return as a specialised exercise influenced by project, sector, country and comparable-investment risks.
Management should document who selected the rate, how it was derived and which cash-flow definition it matches. A spreadsheet cell containing “12%” without that explanation creates an appearance of precision without a decision record.
The measures can favour different projects
Payback tends to favour investments that return cash sooner. IRR highlights the percentage yield implied by the cash-flow pattern. NPV estimates absolute value at the chosen required return.
Those perspectives can produce different rankings when alternatives differ in scale, duration or timing. A smaller project may return the initial investment quickly and show a high IRR, while a larger project produces a greater NPV over a longer life. If only one can be selected, managers must understand why the rankings differ rather than choosing the most attractive number.
Capital constraints, execution capacity and strategic dependencies can also affect the final decision. NPV may show estimated value creation, but it does not establish that the company has enough liquidity, technical capability or regulatory readiness to deliver the project.
Downside analysis changes the conversation
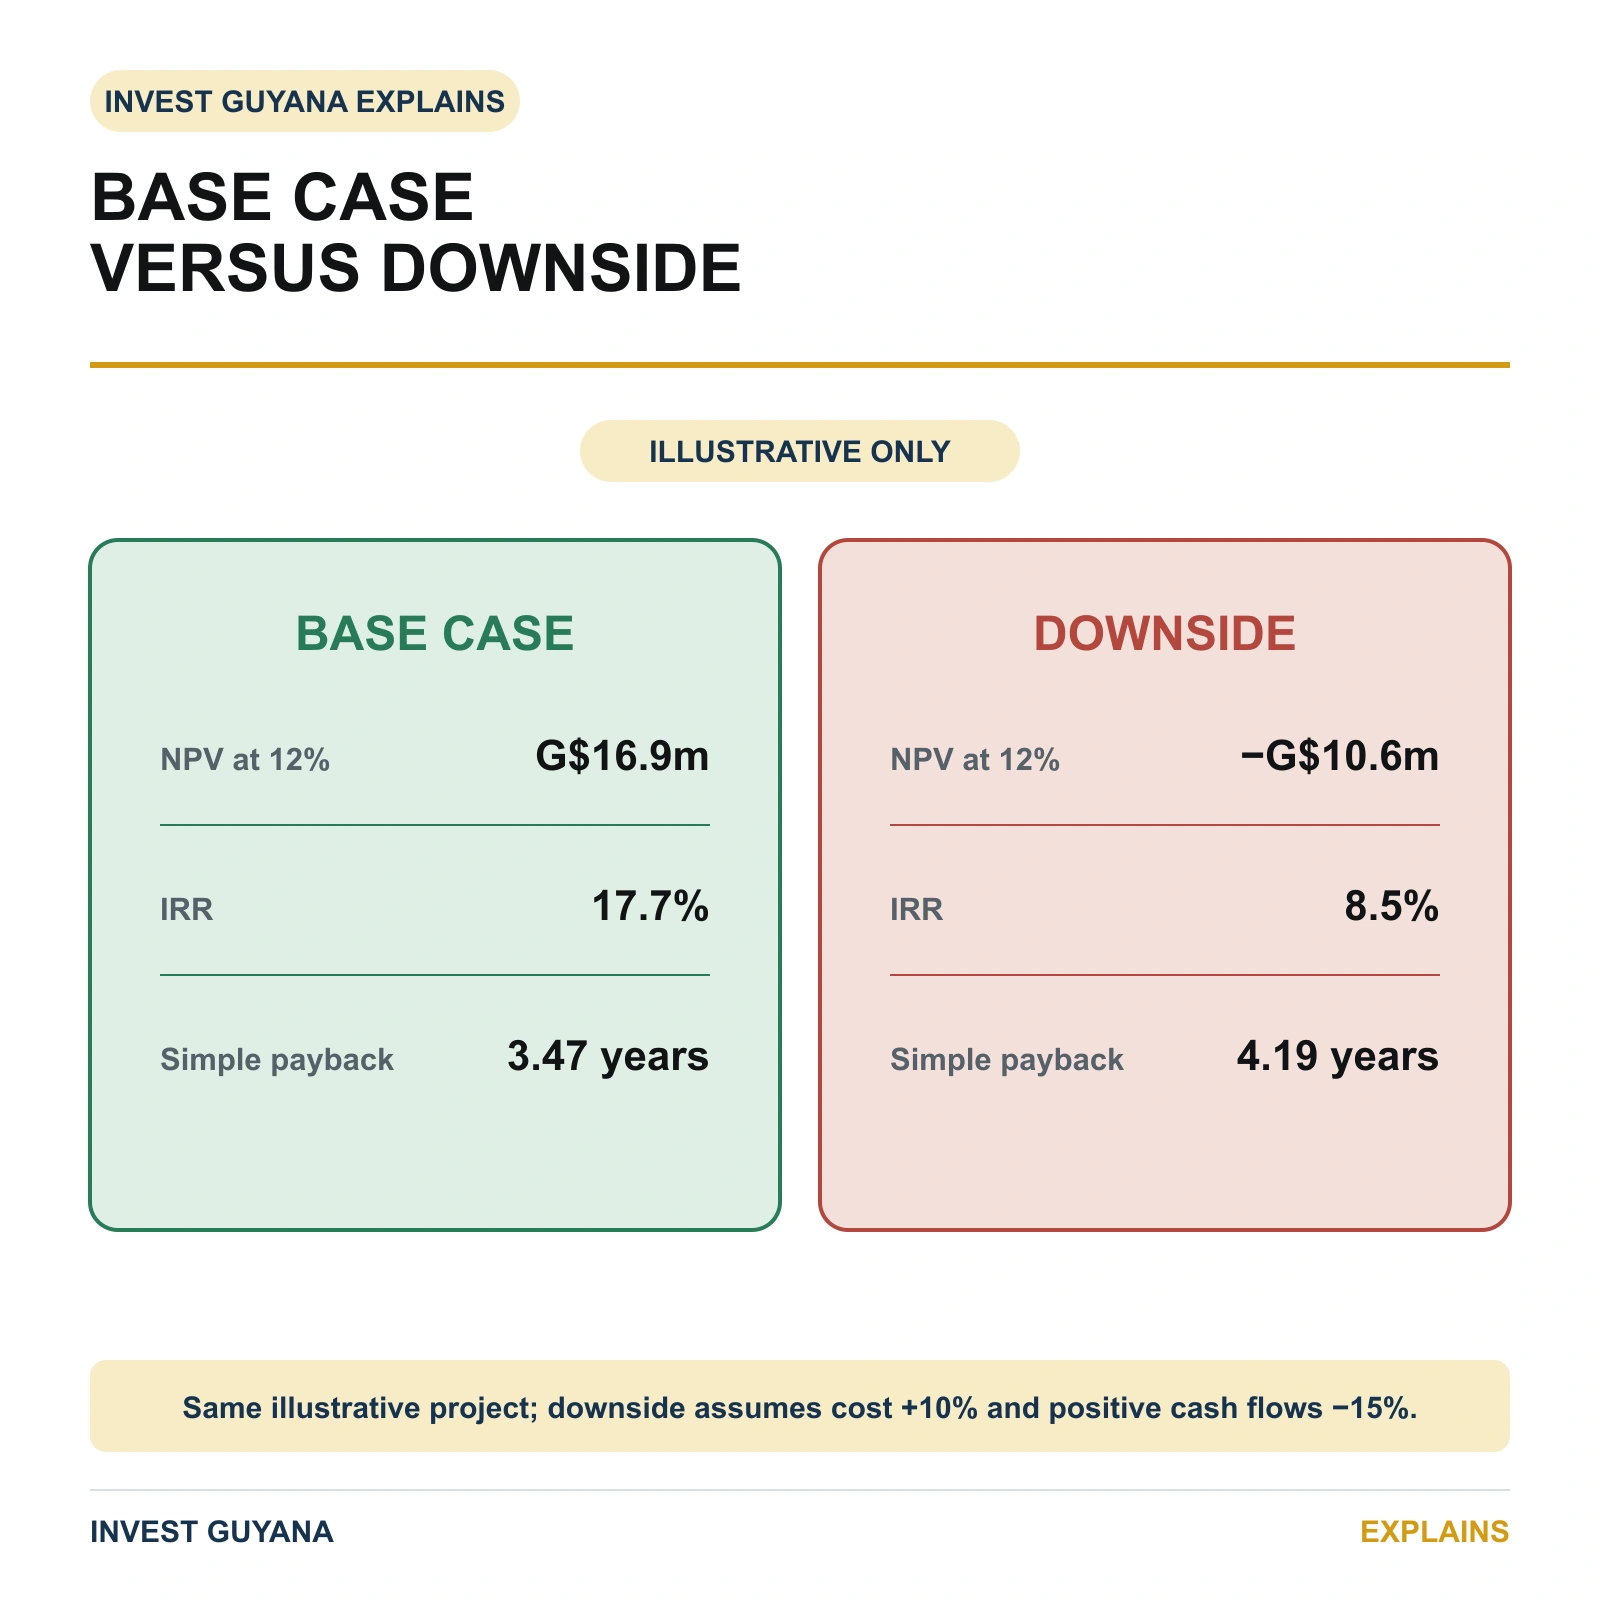
A base case is only one version of the future. Suppose the illustrative project costs 10% more and its positive operating cash flows are 15% lower. At the same 12% discount rate, the NPV becomes approximately negative G$10.6 million, the IRR falls to about 8.5% and simple payback moves to roughly 4.19 years.
Those results do not mean that one metric failed. They reveal that all three depend on the commercial assumptions beneath them.
Sensitivity analysis changes one variable at a time to show which assumptions matter most. Scenario analysis changes several connected assumptions together. Switching-value analysis asks how far an assumption can move before the investment no longer meets the selected test. The UK Green Book, although written for public-sector appraisal rather than private Guyana investment, reinforces the broader principle that sensitivity, risk and non-monetised considerations must accompany summary metrics.
A return is not the whole investment case
No return metric verifies that the site is available, customer demand is contracted, utilities can support the operation or environmental and planning approvals will be obtained. It also cannot resolve whether the project fits the company’s strategy or whether management has the capacity to deliver it.
Back in the boardroom, the three figures no longer compete to be the one “correct” return. Payback tells the directors when the original investment is recovered. IRR shows the rate implied by the cash-flow stream. NPV estimates the value created above the required return.
The better decision comes from asking all three questions, examining the assumptions and then testing whether the project can survive a future less favourable than the base case.
The companion Invest Guyana Guide, How to Build a Basic Investment-Appraisal Model for a Guyana Project, turns these concepts into a controlled working model.
Editorial note: This article provides general educational information, not financial, tax, accounting or investment advice. All figures and scenarios are illustrative. Project cash flows, discount rates and decision criteria require project-specific professional review.