Photo: Invest Guyana
An illustrative Guyanese agro-processor is considering a G$100 million packaging line. Management has supplier quotations and a sales forecast, but the figures sit in separate files. One forecast includes inflation, another does not, and the project paper calculates profit without showing the working-capital cash required to support higher sales.
A useful investment-appraisal model does more than calculate an NPV or IRR. It creates a traceable connection between assumptions, project cash flows, return measures, risks and the decision management is being asked to make.
This Guide provides a basic structure. It does not prescribe a Guyana discount rate, tax treatment or lending threshold. Those inputs depend on the company, project, financing structure and rules in force.
1. Define the decision before opening the model
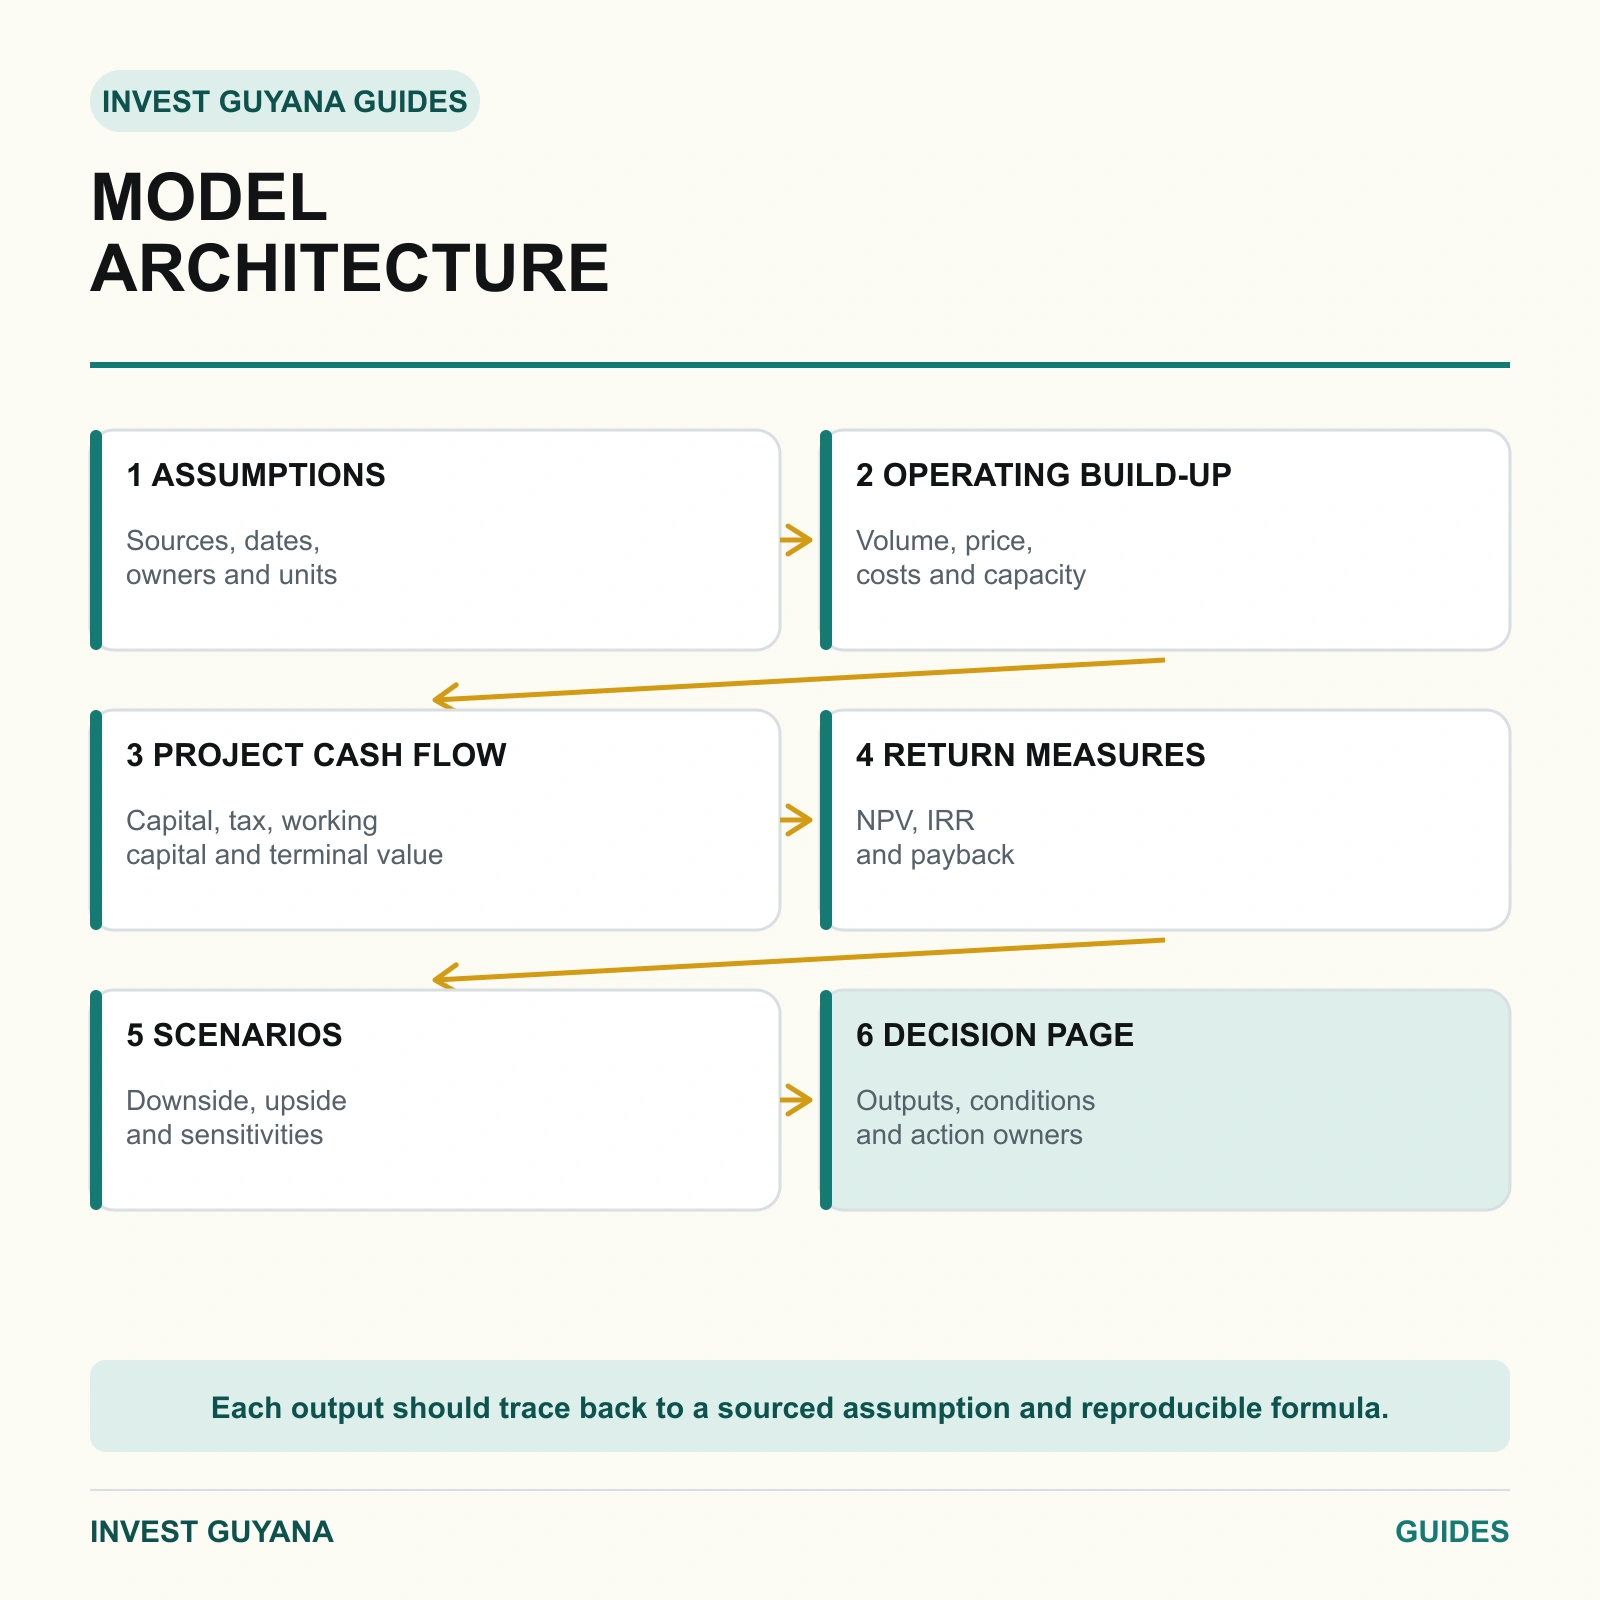
Write one sentence stating the decision. For example:
Decide whether to invest in the proposed packaging line, defer it or continue with the existing process.
Then define:
- the business-as-usual position;
- the investment alternatives being compared;
- the project start and operating dates;
- the forecast horizon;
- the reporting currency and unit;
- whether periods are monthly, quarterly or annual;
- whether the model measures project or equity cash flow; and
- who owns the model and approves assumptions.
The model should compare future outcomes with and without the investment. Costs already incurred are normally sunk and should not be inserted merely because they appear in the accounting records. An existing building or piece of equipment used by the project may still have an opportunity cost if the company gives up another use or sale.
2. Build an assumptions register
Do not bury inputs inside formulas. Keep one controlled assumptions sheet with source, date, owner and scenario.
| Assumption | Base case | Source and date | Owner | Downside question |
|---|---|---|---|---|
| Initial capital cost | G$100m | Current supplier and installation quotations | Project lead | What if total cost rises 10%? |
| Year-one cash flow | G$20m | Volume, price and cost build-up | Commercial/finance | What if ramp-up is delayed? |
| Forecast horizon | Five years | Asset and commercial plan | Board sponsor | Is a longer useful life supported? |
| Terminal recovery | Included in year five | Asset and working-capital schedule | Finance | Is recovery achievable and net of disposal costs? |
| Discount rate | 12% | Illustrative only | Finance/board | What project-specific return is supportable? |
All values and dates in this Guide are illustrative. A production model should attach or reference the actual quotation, contract, official rate, management approval or professional opinion supporting each material input.
3. Construct future incremental cash flow
The model should forecast cash caused by the decision, not simply copy accounting profit.
A basic project cash-flow bridge can be organised as:
Incremental revenue
– incremental cash operating costs
– project tax payments
– capital expenditure
– increase in working capital
+ release of working capital
+ net asset or terminal proceeds
= incremental project cash flow
Depreciation is an accounting charge rather than a cash payment, although capital allowances or other tax treatment may affect tax cash flows. Interest and principal should normally remain outside an unlevered project cash-flow forecast because financing is considered separately; inserting debt service and then using a discount rate that already reflects financing can double count its effect.
ACCA’s investment-appraisal guidance emphasises future incremental cash flows, consistent treatment of inflation and the cash effect of changes in working capital.
For a Guyana project, tax assumptions should be reconciled to current Guyana Revenue Authority information and professional advice. If equipment, inputs or revenues are denominated in another currency, record the exchange-rate source and date, such as the Bank of Guyana’s published market information, and model the commercial rate actually expected where appropriate. Do not hard-code today’s tax or exchange rate as a permanent assumption.
4. Lay out the cash-flow timeline
The illustrative base case is:
| Year | Project cash flow, G$m | Present value at 12%, G$m | Undiscounted cumulative cash flow, G$m |
|---|---|---|---|
| 0 | -100 | -100.0 | -100 |
| 1 | 20 | 17.9 | -80 |
| 2 | 28 | 22.3 | -52 |
| 3 | 34 | 24.2 | -18 |
| 4 | 38 | 24.1 | 20 |
| 5 | 50 | 28.4 | 70 |
The year-five cash flow includes an illustrative terminal recovery. The present values are rounded, so displayed totals may differ slightly from the underlying calculation.
For a real project, the timeline may need construction months, commissioning, ramp-up, maintenance shutdowns and contract-specific receipts rather than five neat annual periods. The period used in the model should match how the project will actually spend and receive cash.
5. Calculate the three return measures
Net present value
Use:
NPV = Σ CFt ÷ (1 + r)^t
For the illustrative base case, NPV at 12% is approximately positive G$16.9 million.
Some spreadsheet NPV functions discount only cash flows beginning in period one. In that case, the year-zero outlay must be added separately. Check the software’s definition rather than assuming that selecting the entire row produces the correct answer.
Internal rate of return
IRR is the rate r that makes NPV equal zero. The illustrative cash flow produces an IRR of approximately 17.7%.
Confirm that the cash-flow range includes the initial negative value and every later period. Where cash flows change sign more than once, a spreadsheet can produce multiple IRRs or a result that is not decision-useful. Retain the NPV profile and investigate the pattern rather than forcing one percentage into the summary.
Simple payback
Add the undiscounted cash flows until the initial outlay is recovered. At the end of year three, G$18 million remains outstanding. Dividing that amount by the G$38 million year-four cash flow gives 0.47, for a payback period of approximately 3.47 years. This fractional calculation assumes the year-four cash flow accrues evenly through the year. If cash is seasonal or irregular, model monthly or quarterly periods or report only the completed-period result.
If management uses discounted payback, label it clearly so it is not confused with the simple calculation.
6. Keep project and equity returns separate
A project appraisal can answer two related questions:
- Does the underlying asset or operation create value before considering its financing structure?
- What return may the shareholders receive after debt drawdowns, interest, principal and other financing flows?
Build the operating project case first. Then add a separate financing schedule showing debt drawdown, fees, interest, repayment and any reserves. From that schedule, derive the equity contributions and distributions.
Label outputs as project NPV/IRR or equity NPV/IRR. Do not compare an equity IRR with a project discount rate or present a highly leveraged equity return as if it describes the operating project’s underlying performance.
The debt schedule should also reconcile with the cash-flow statement and the financing assumptions used in the lender-ready project pack.
7. Create base, downside and upside scenarios
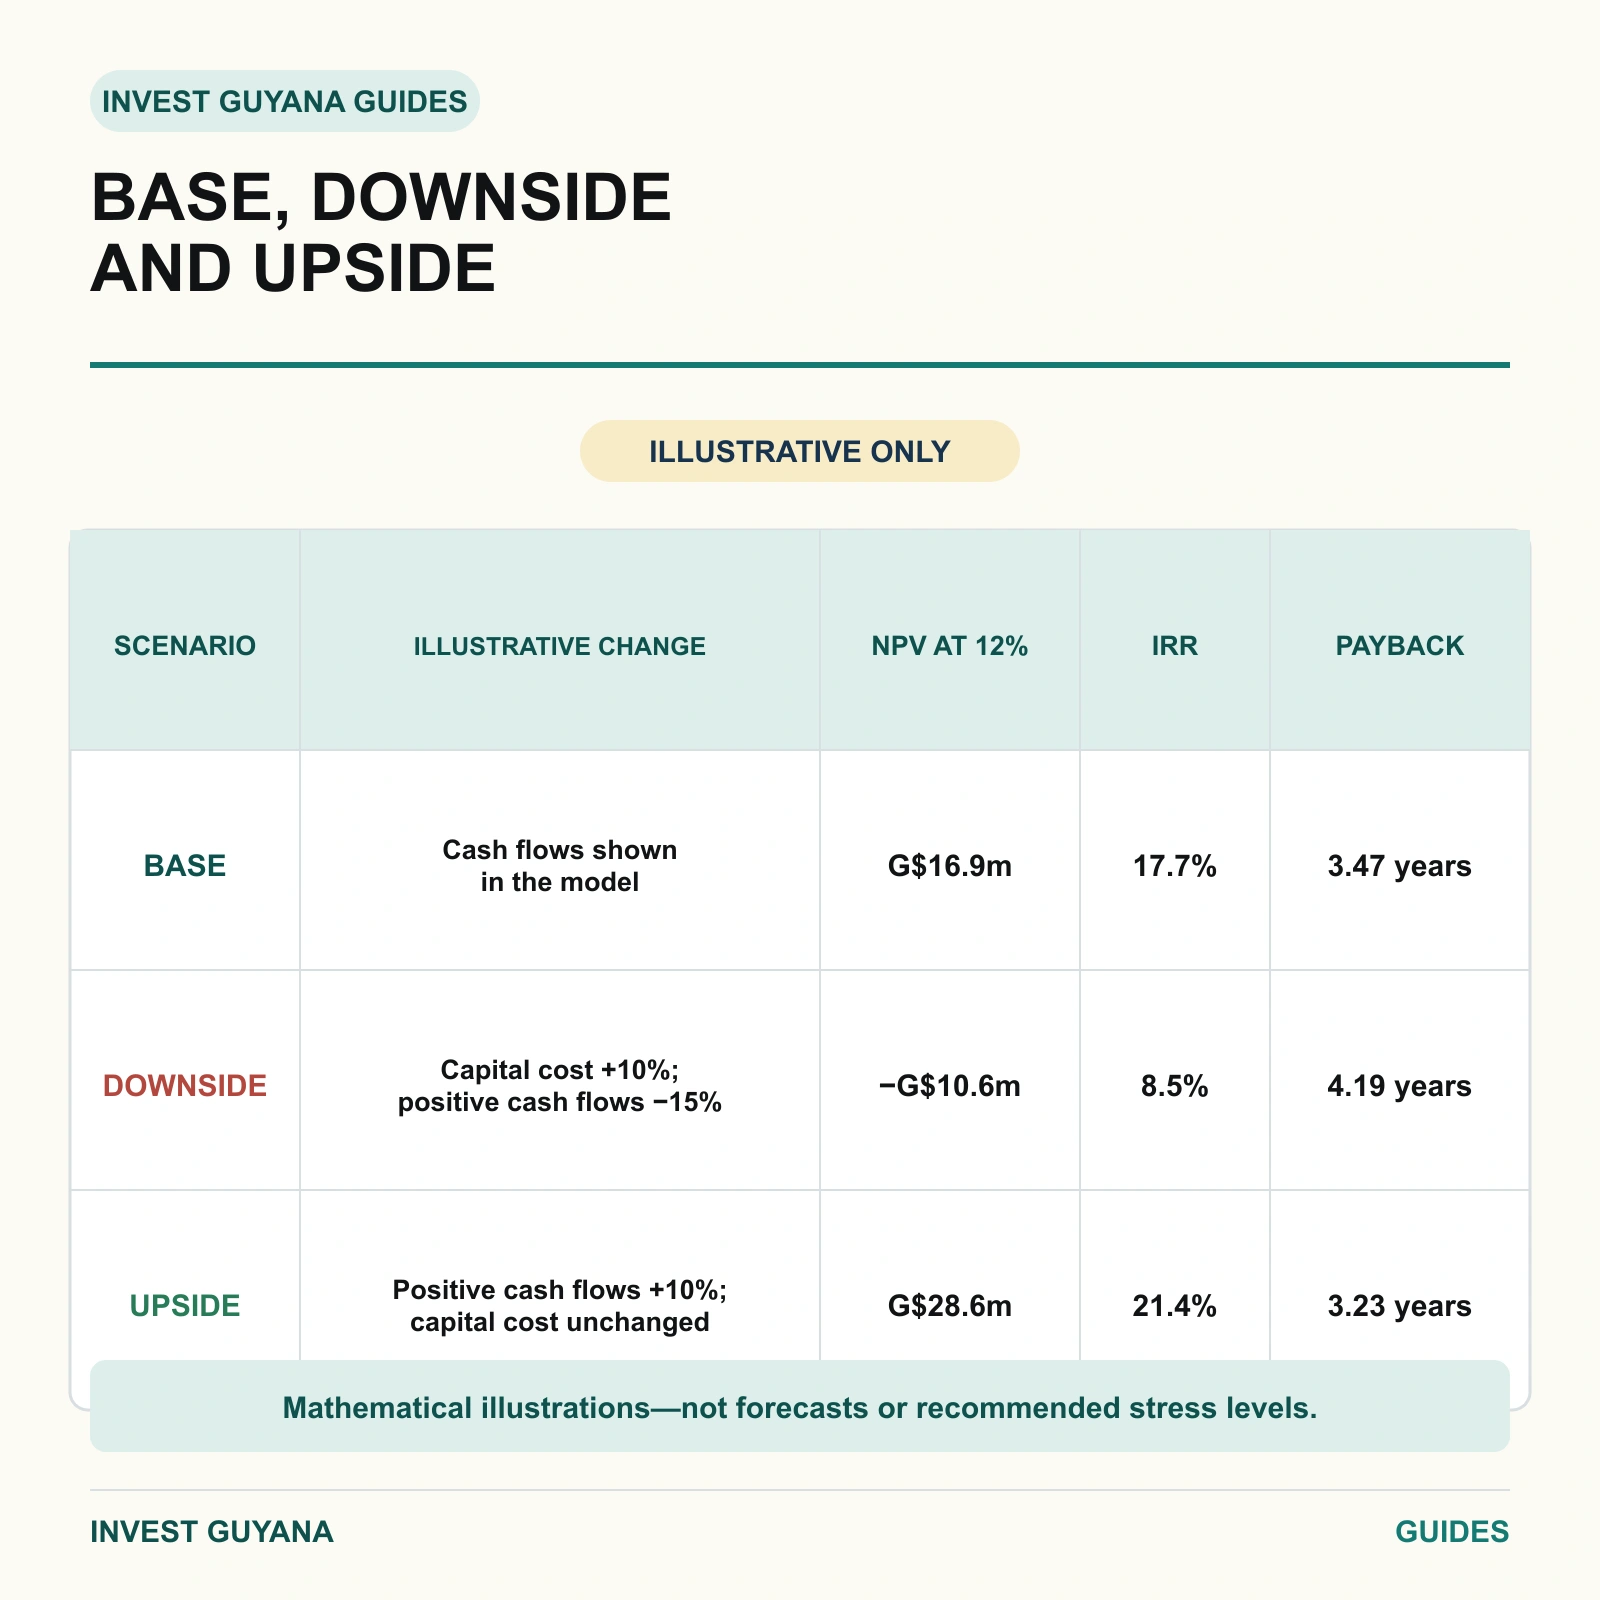
A scenario should change a coherent set of assumptions, not merely overwrite the final cash-flow row.
| Scenario | Illustrative change | NPV at 12% | IRR | Simple payback |
|---|---|---|---|---|
| Base | Cash flows shown above | G$16.9m | 17.7% | 3.47 years |
| Downside | Capital cost +10%; positive cash flows -15% | -G$10.6m | 8.5% | 4.19 years |
| Upside | Positive cash flows +10%; capital cost unchanged | G$28.6m | 21.4% | 3.23 years |
These scenarios are mathematical illustrations, not forecasts or recommended stress levels. Their fractional payback periods use the same even-within-year accrual assumption; a production model should use the project’s actual cash timing.
For a Guyana operating project, scenario drivers may include:
- construction cost and completion timing;
- customer volume and selling price;
- electricity, fuel and imported-input costs;
- foreign-exchange movements;
- working-capital days;
- plant utilisation and downtime;
- tax classification and incentive eligibility;
- maintenance and replacement capital; and
- terminal value or closure cost.
Record which assumptions change in each scenario and preserve the base case rather than overwriting it.
8. Add sensitivity and switching-value tests
Sensitivity analysis changes one assumption at a time. It helps identify whether the model is most exposed to price, volume, capital cost, delay, exchange rate or another driver.
Scenario analysis changes connected assumptions together. A late commissioning date, for example, may delay revenue, increase construction-period costs and postpone working-capital recovery.
A switching value asks how far an assumption can deteriorate before the NPV reaches zero or another decision boundary is crossed. It can show management that a project remains positive until volume falls by a certain amount—or that a small cost overrun removes the expected value.
The point is not to produce more tables. It is to identify the assumptions that require stronger contracts, contingency, management attention or further evidence.
9. Install model-control checks
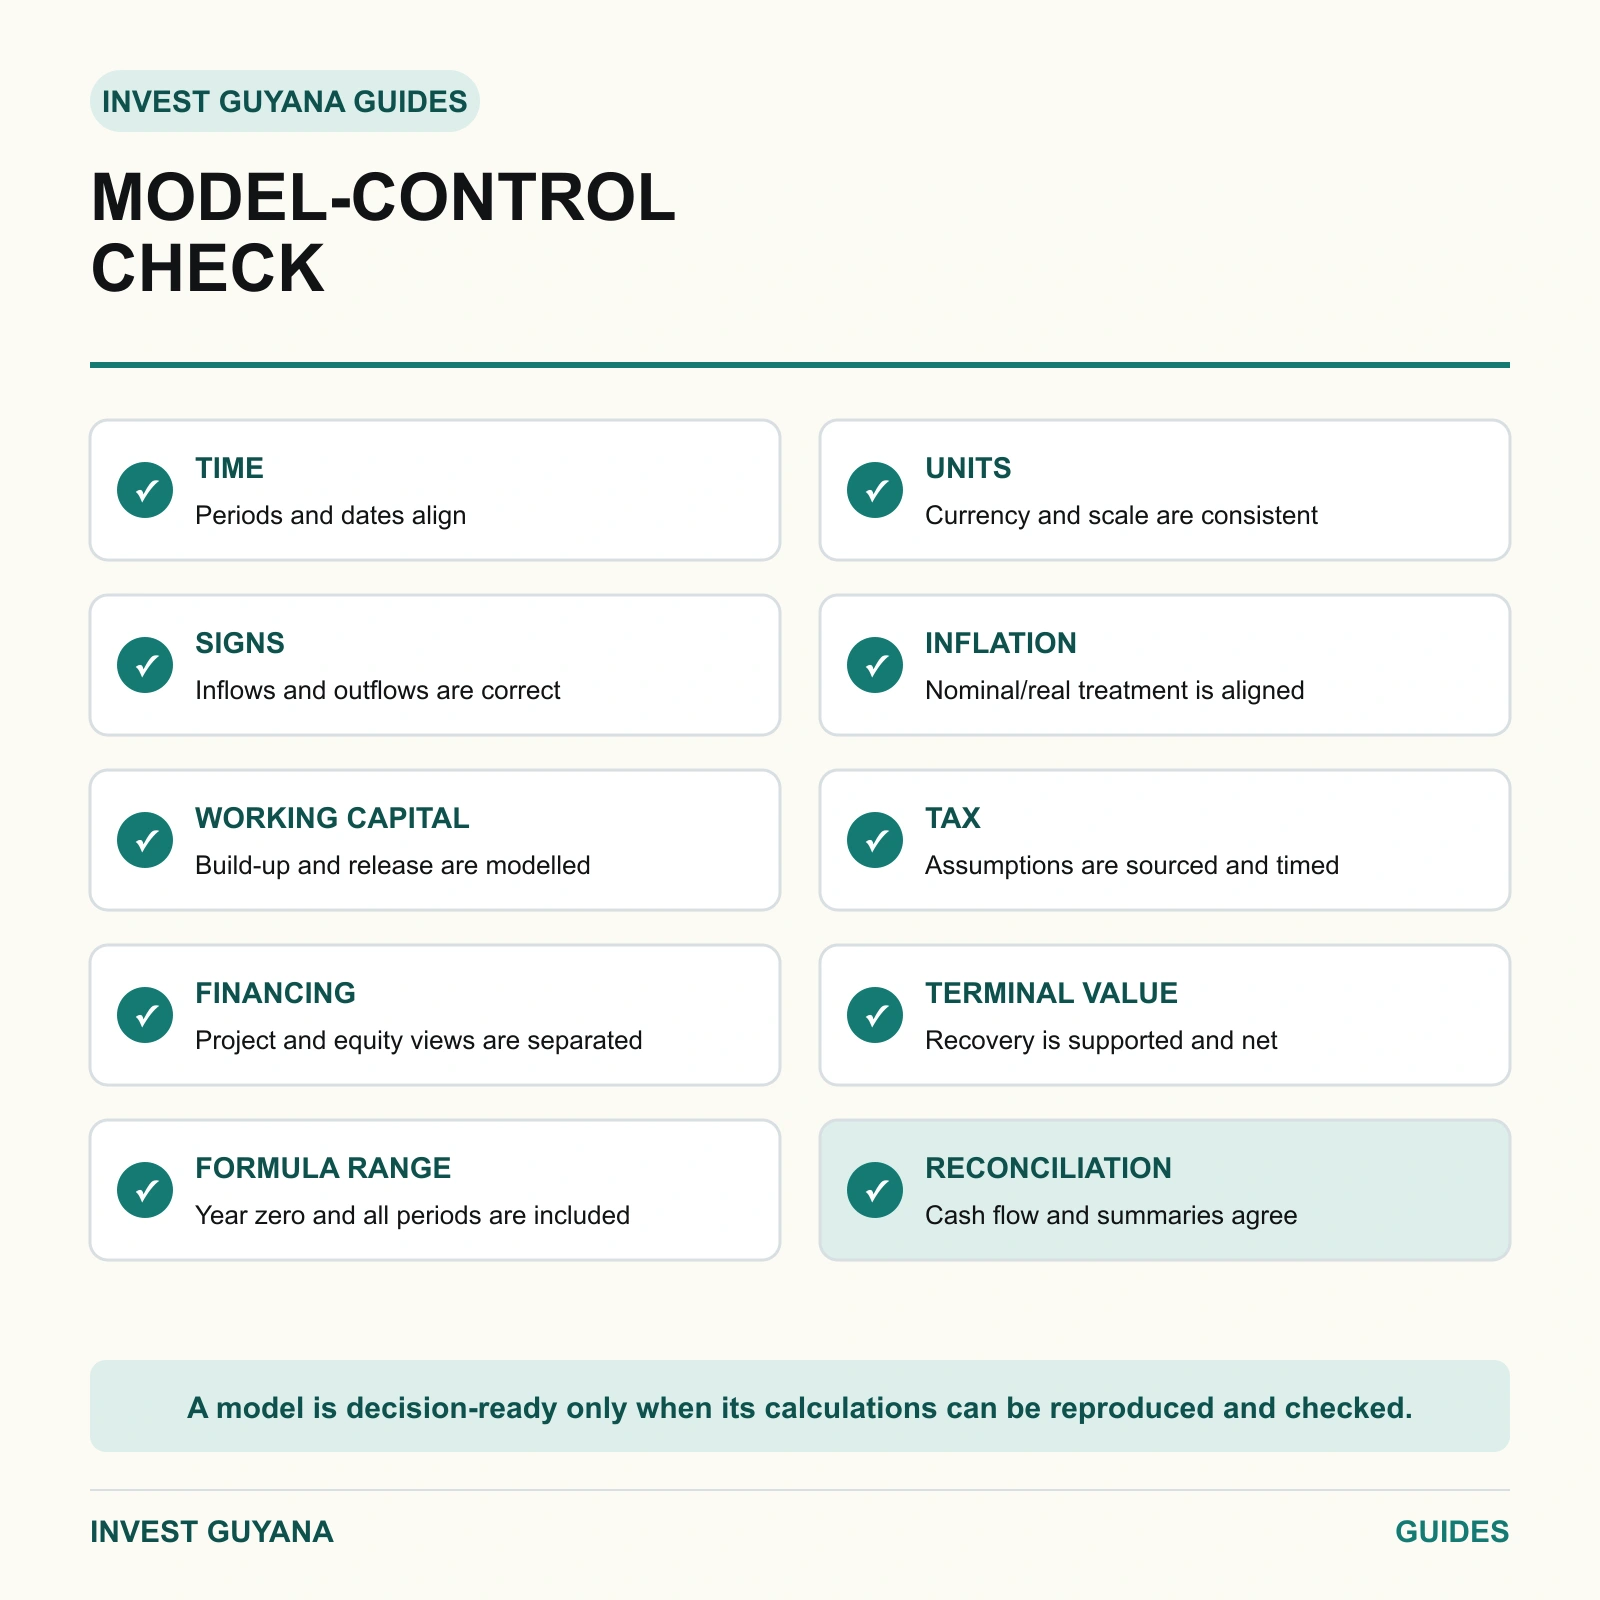
| Control | Test |
|---|---|
| Time | All cash flows fall in the period in which cash is expected to move |
| Units | Currency, thousands/millions and percentages are stated once and used consistently |
| Signs | Outflows are negative and inflows positive throughout |
| Inflation | Nominal cash flows use a consistent nominal rate; real cash flows use a consistent real rate |
| Working capital | Only changes are modelled, with any justified release shown separately |
| Tax | Tax cash flows follow current project-specific treatment and timing |
| Financing | Project cash flow is not mixed with debt or equity cash flow |
| Terminal value | Residual value, disposal costs and recovery assumptions are documented |
| Formula range | Every return calculation includes the intended periods and correct year-zero treatment |
| Reconciliation | Scenario outputs reconcile with the detailed cash-flow statement |
Protect formula cells, use version numbers and keep a change log. A reviewer should be able to distinguish an input, a formula and an output without opening every cell.
10. Prepare the decision page
The summary page should show:
- the decision being requested;
- base, downside and upside assumptions;
- project and equity results, separately labelled;
- funding requirement and peak cash exposure;
- key sensitivities and switching values;
- assumptions awaiting evidence;
- non-financial constraints and approvals;
- recommended action and conditions; and
- model owner, reviewer, version and date.
Do not paste only the highest IRR into the board paper. Show what has to be true for the result to occur and what management proposes to do if those assumptions weaken.
Pre-circulation checklist
- ☐ The decision and business-as-usual case are defined.
- ☐ Every material input has a source, date and owner.
- ☐ Cash flows are future, incremental and correctly timed.
- ☐ Tax, working capital, inflation and foreign exchange are treated consistently.
- ☐ Project and equity cash flows are separated.
- ☐ NPV, IRR and payback use the correct ranges and definitions.
- ☐ Base, downside and upside scenarios remain independently reproducible.
- ☐ Sensitivities identify the assumptions that drive value.
- ☐ Formula, sign, unit and reconciliation checks pass.
- ☐ The summary discloses unresolved evidence and non-financial constraints.
- ☐ A competent finance professional has independently reviewed the production model.
A basic model becomes decision-ready when another reviewer can trace its assumptions, reproduce its calculations and understand why the outcome changes.
The companion Invest Guyana Explainer, Investment Returns Explained: Why NPV, IRR and Payback Answer Different Questions, explains how to interpret the outputs without treating one metric as the whole decision.
Editorial note: This Guide provides general educational information, not accounting, tax, investment or financial advice. All values, rates and scenarios are illustrative. A live project requires current official inputs and independent professional review.