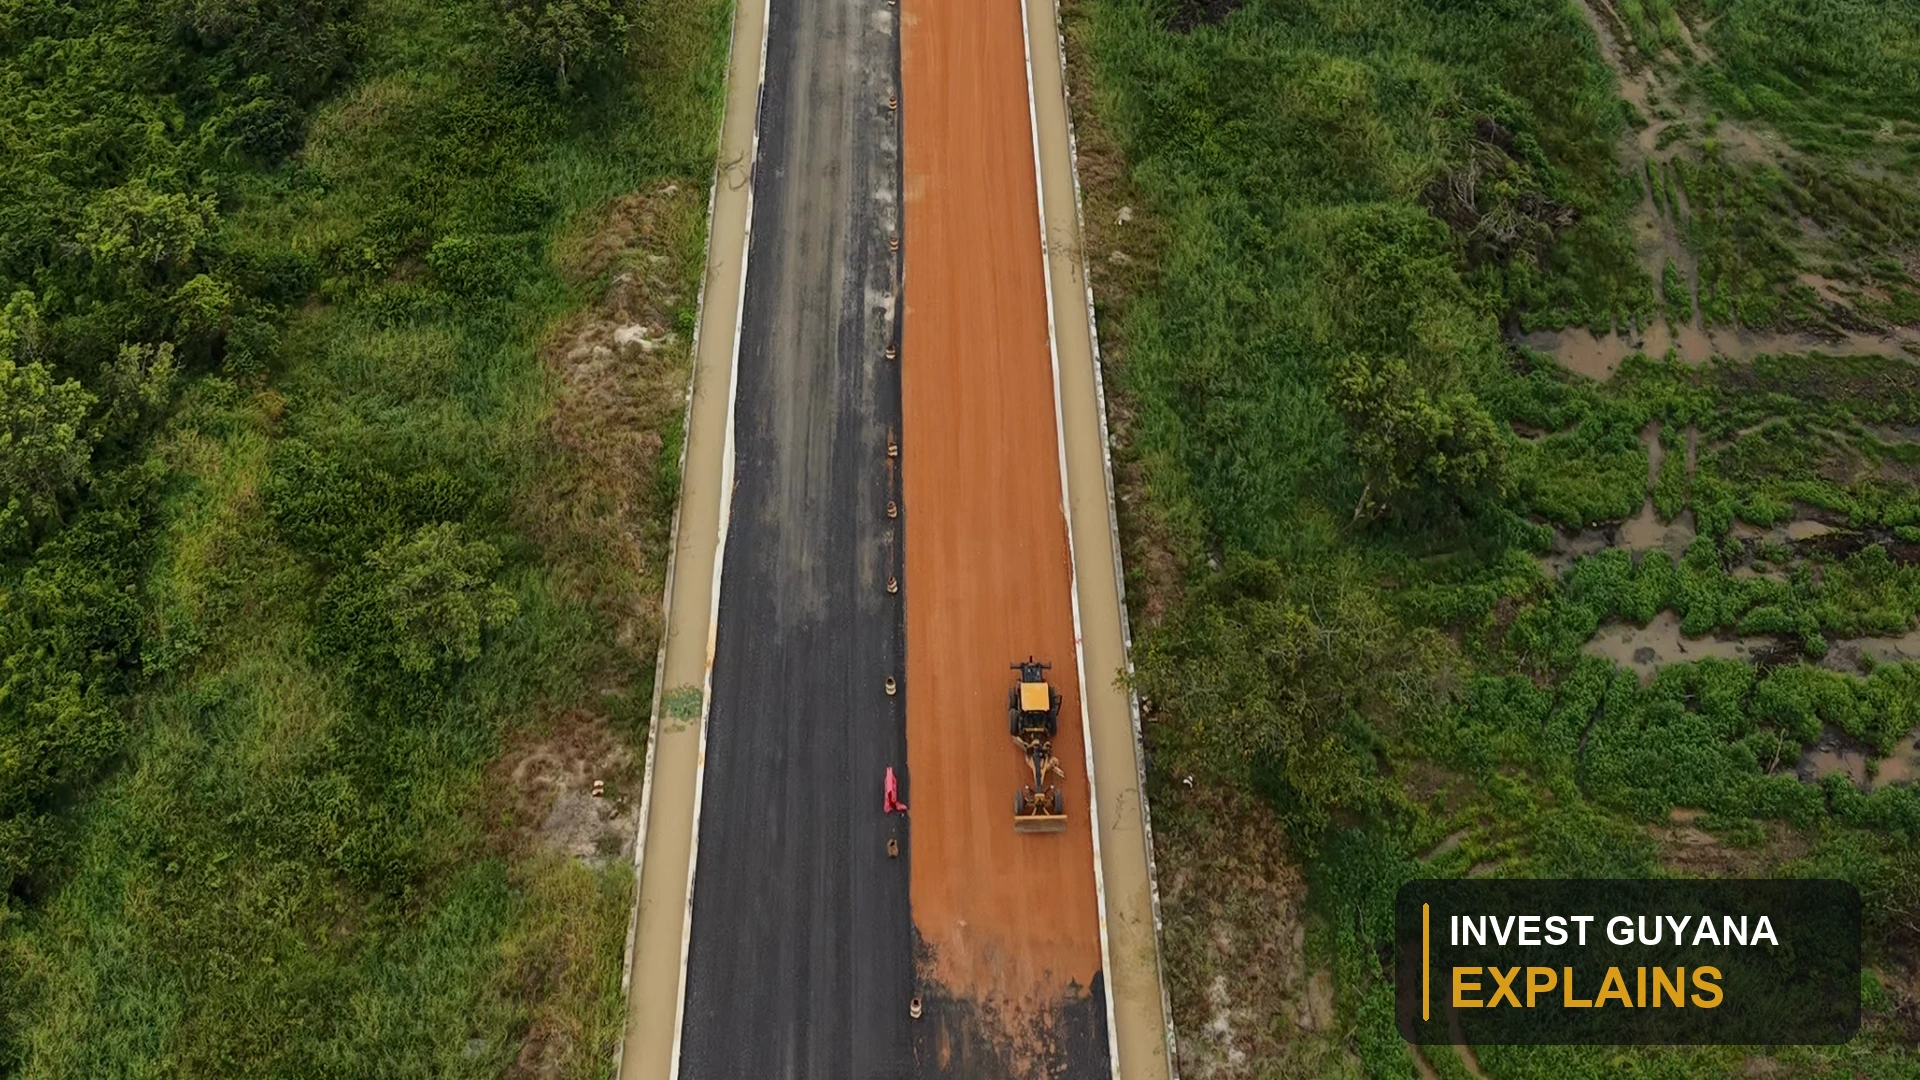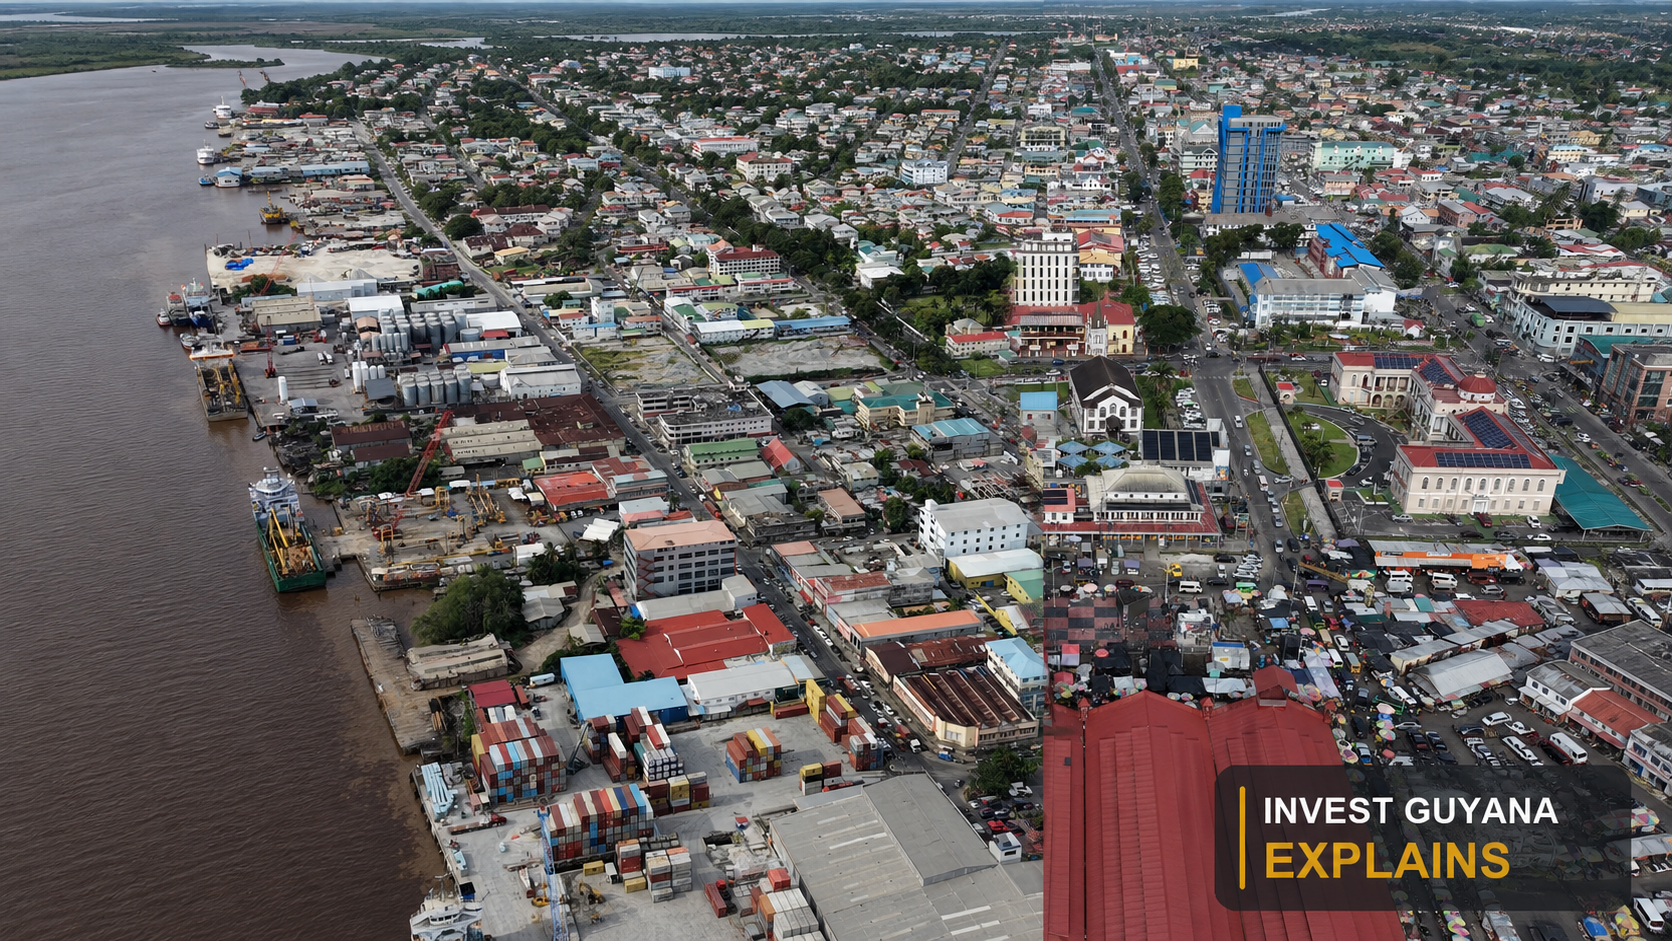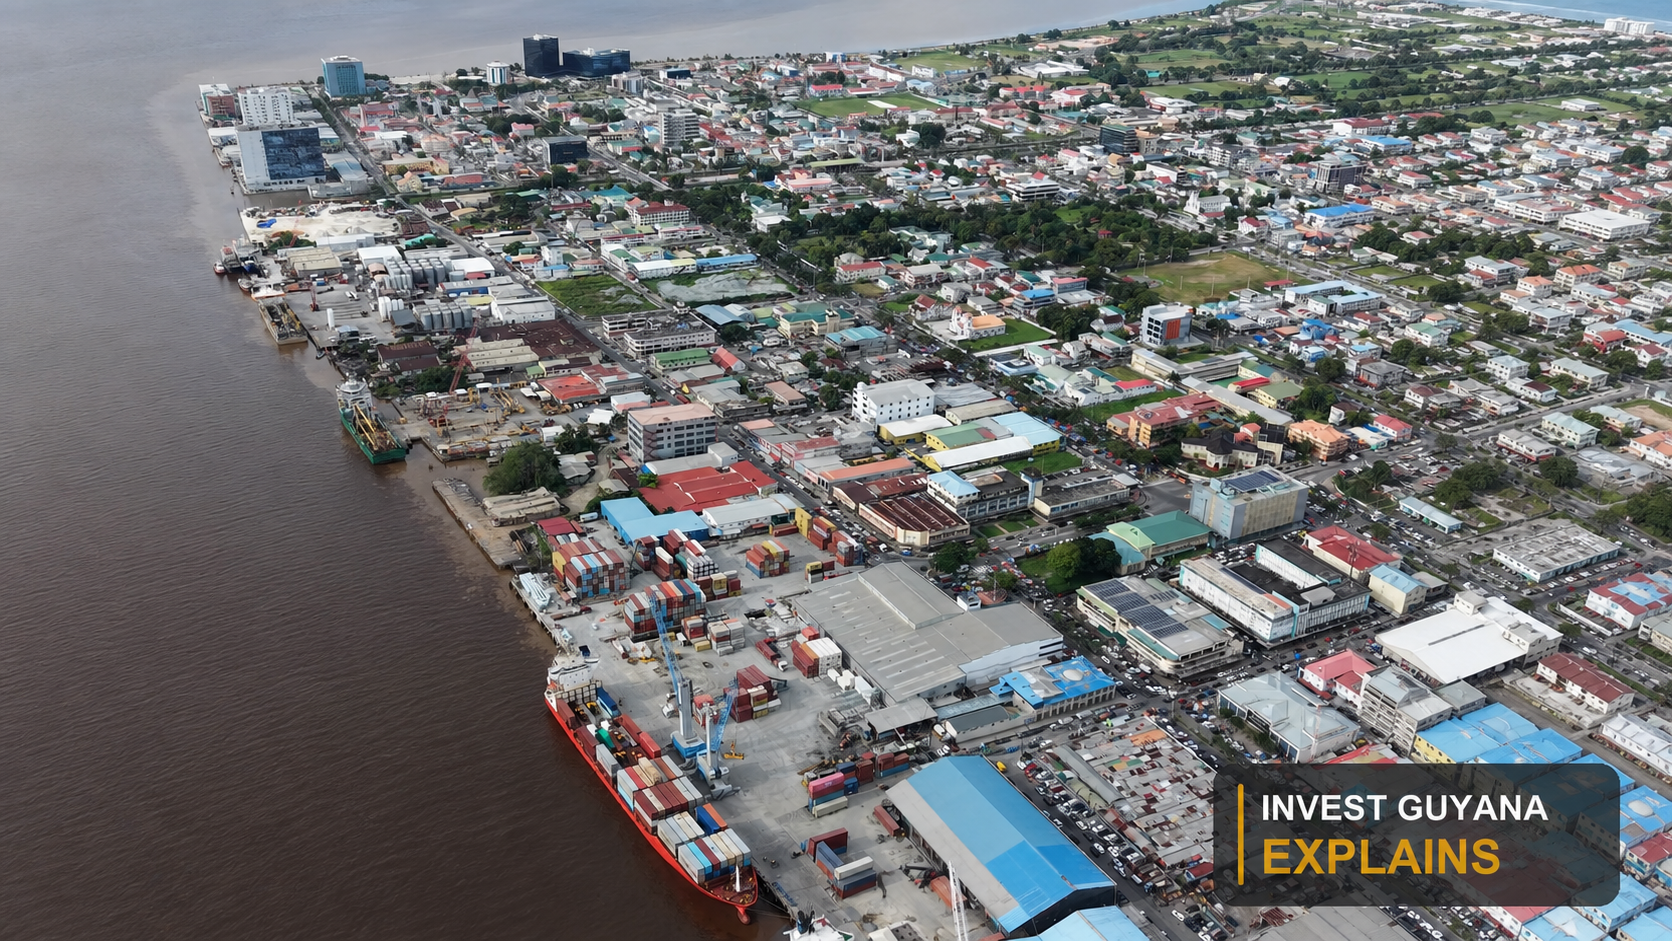
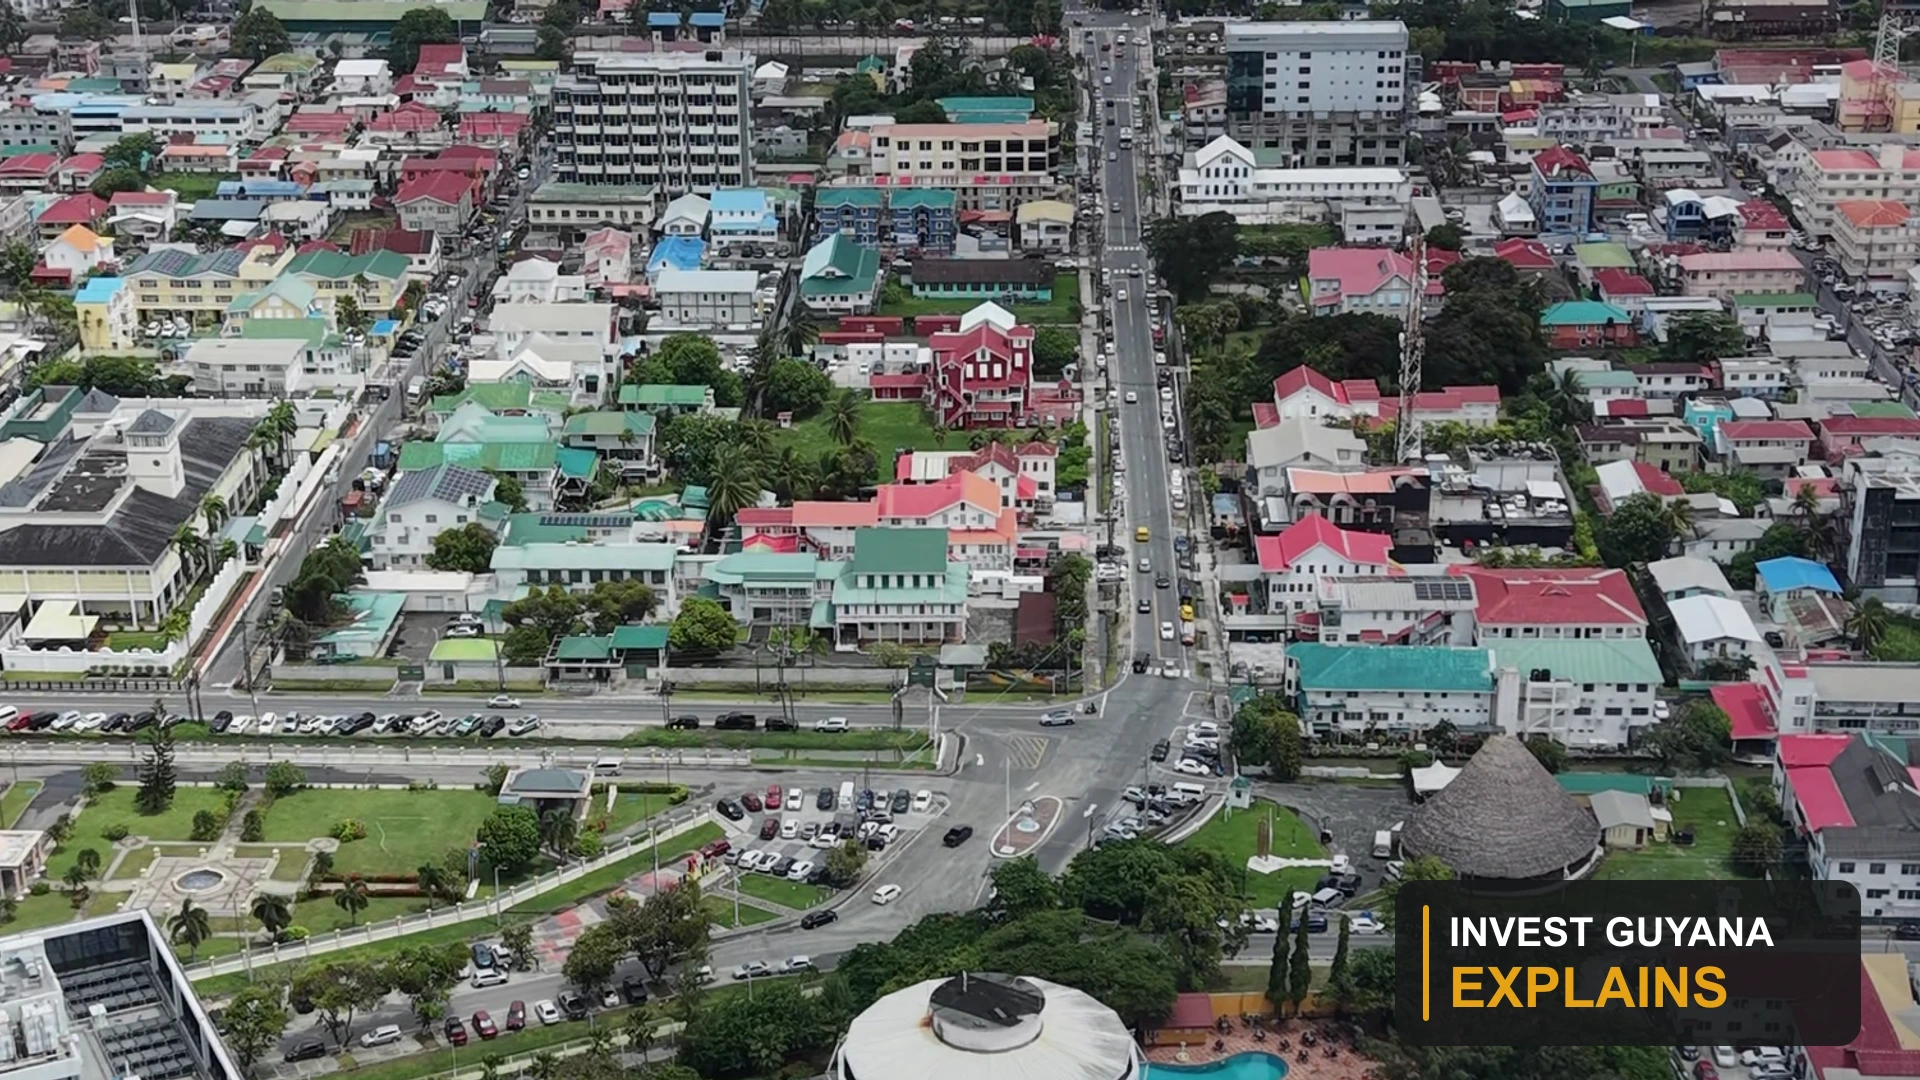
Drone photograph from Invest Guyana’s media archive; contextual image, not the hypothetical project described.
Imagine a restaurant owner reading a headline about another year of rapid economic growth in Guyana. The figure is striking, and an overseas partner immediately sees a reason to expand. If the country is producing so much more, the partner argues, surely a larger dining room will attract proportionately more customers.
The owner is interested, but the reservation book raises a more specific question. Which customers would fill the additional tables, on which days, and at what prices? A national growth figure can describe an important change in the economy without answering any of those questions directly.
GDP is valuable precisely because it gives a broad view. The difficulty begins when that broad view is asked to stand in for evidence about an individual market. Understanding what the measure includes helps investors use economic headlines as context rather than as a sales forecast.
Measuring what an economy produces
Gross domestic product measures the monetary value of final goods and services produced within a country over a stated period. It concerns goods and services, including activity across industries that may look very different from one another. It is not the amount of money in the government’s bank account, nor is it a total of every company’s cash receipts. IMF explanation of GDP.
The distinction can be illustrated through a hypothetical bakery. Flour becomes bread, and bread is sold to customers. Simply adding every transaction along that chain would count some value more than once. National accounting is designed to measure production without treating each intermediate purchase as additional final output.
For our restaurant owner, this explains why GDP cannot be read as a pool of cash waiting to be spent on meals. The figure represents economic activity across the country. The route from that activity to household spending, business travel or demand for restaurant services involves further relationships that the headline does not reveal.
Those relationships can still matter enormously. A project may employ workers, purchase services or create demand for accommodation. The point is to identify the connection rather than assume that every enterprise receives the same share of the national expansion.
Separating more output from higher prices
A business can report higher sales because it served more customers, charged higher prices or experienced both changes. The same basic interpretive problem appears in national statistics. A larger money value does not necessarily mean that the economy produced proportionately more goods and services.
Economists therefore distinguish nominal GDP, measured at current prices, from real GDP, which adjusts for price changes. Guyana’s Bureau of Statistics publishes current-price and constant-price series, together with growth and industry-contribution tables. The labels matter because they identify what is being compared. Bureau of Statistics national accounts.
Imagine that the restaurant sells the same number of lunches as before but raises the price of each lunch. Its revenue increases even though the number of meals served does not. A different restaurant might increase meal sales while holding prices steady. Both report more revenue, but their operational stories are different.
Reading a GDP release involves a similar discipline. Before interpreting a percentage, the reader needs to know whether it concerns current values or price-adjusted output, which period it covers and which comparison is being made. Those details are part of the meaning of the figure, not technical decoration beneath it.
Looking inside Guyana’s headline
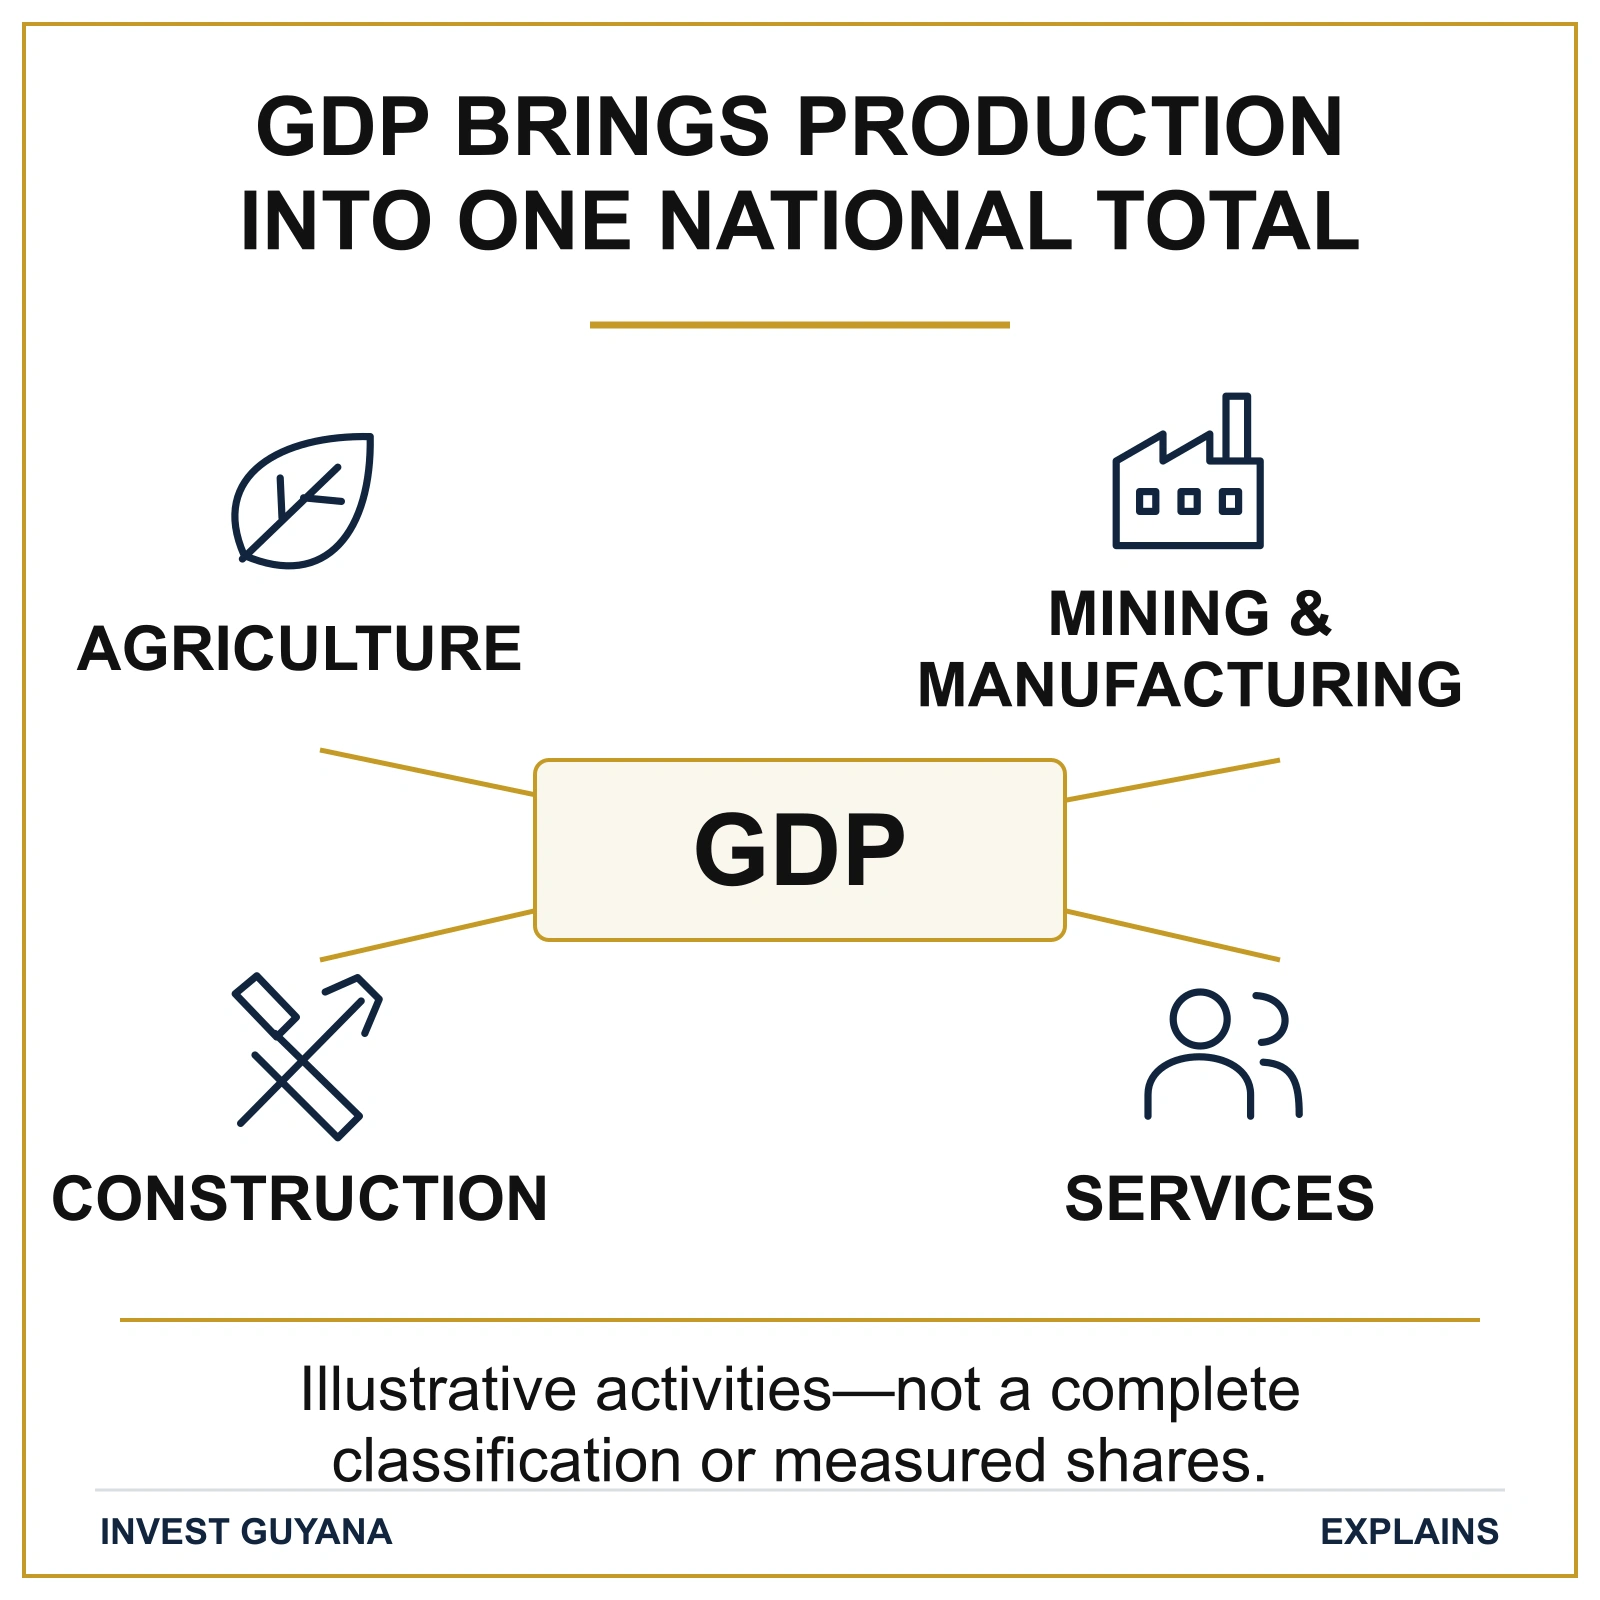
Guyana’s economy makes the distinction between the national total and its components especially important. Oil production can influence the aggregate sharply, while construction, agriculture, services and other activities follow their own paths. A national number combines these movements without showing how each one reaches a particular business.
The Ministry of Finance’s Budget 2026 discussion separates overall and non-oil performance. The IMF’s July 2026 staff assessment also distinguishes the two and discusses construction’s contribution to non-oil activity. These dated assessments support reading the economy in parts, rather than treating the overall growth figure as a description of every market. Budget 2026; IMF’s July 2026 staff assessment.
Our restaurant owner might find that business travel is more relevant to weekday demand than the volume of an exported commodity. A supplier of construction materials may be more interested in the location and timing of building projects. A farm serving a domestic market may face a different combination of demand, weather and distribution constraints.
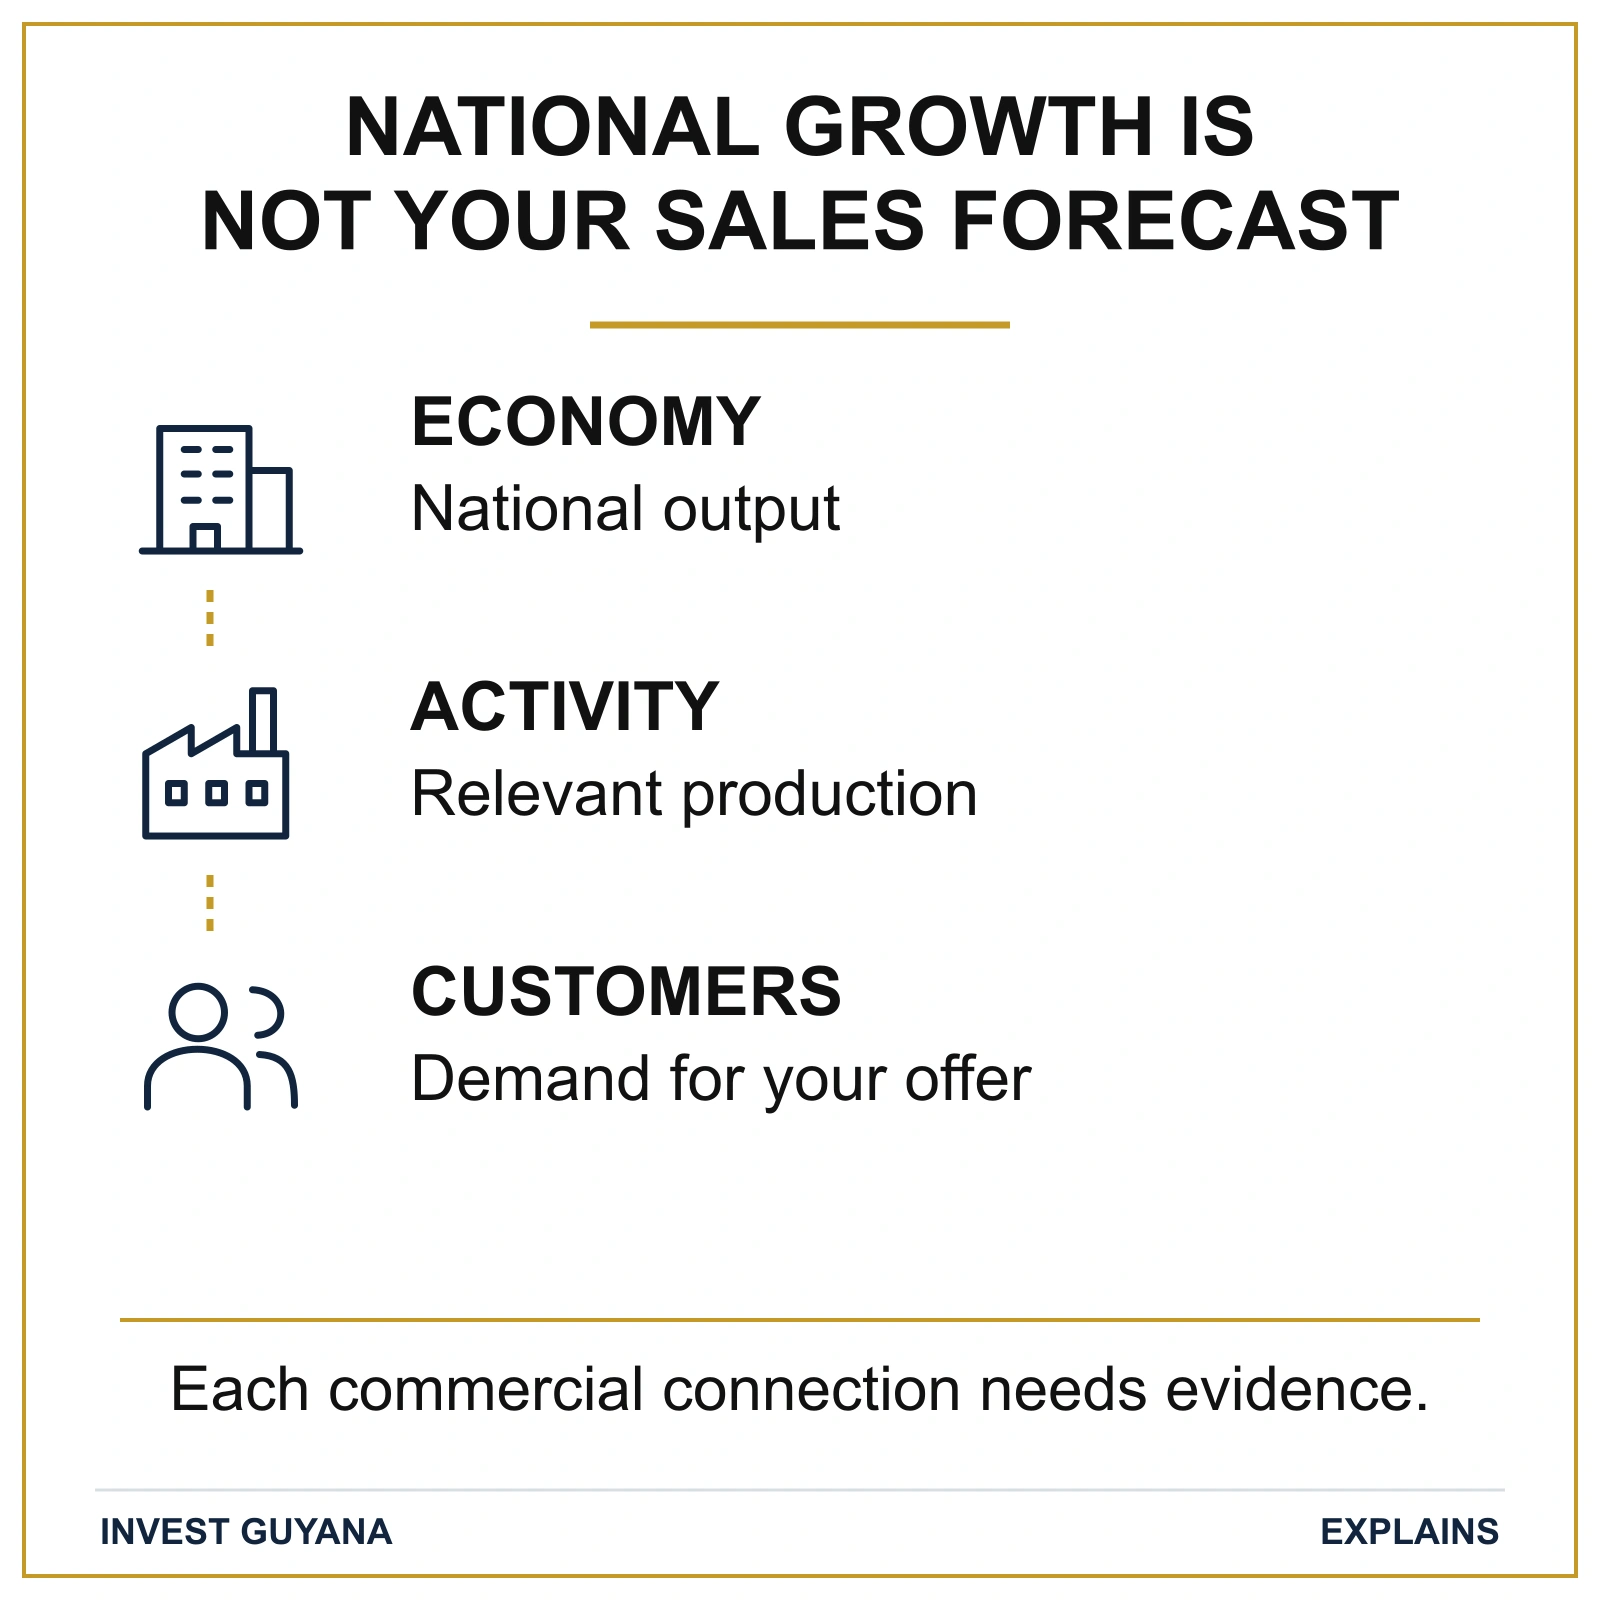
None of these examples makes the national figure irrelevant. Instead, they show why the useful next question is about transmission: through which customers, contracts, wages, purchases or infrastructure could broader economic activity affect this business? The answer provides a bridge between the headline and the operating decision.
Growth is different from market size
A percentage describes change relative to a starting point. It does not, on its own, establish the size of the market being considered. A small activity growing quickly may still offer fewer immediate customers than a much larger activity expanding more slowly.
Consider two hypothetical catering opportunities. One grows from ten events to fifteen, while another rises from one hundred events to one hundred and ten. The first has the faster percentage growth, but the second adds more events. An investor looking only at the percentage could misunderstand both the present scale and the additional volume.
A similar caution applies when comparing growth across sectors or years. The starting level, the period and unusual changes can affect the apparent rate. A business decision needs to distinguish a large ongoing market from a temporary surge, and a recovery from a low starting point from a permanently higher operating level.
This is not an argument for replacing statistics with instinct. It is an argument for using the appropriate statistic for the question. National output, industry growth, customer numbers and achievable sales are related measures, but each describes something different.
For the restaurant, this may mean distinguishing a busy opening period from repeat custom. A short surge can justify investigation without establishing the level of demand needed to support permanent capacity.
Output does not describe every person’s experience
An economy can produce more while the benefits and pressures are experienced unevenly. People work in different sectors, live in different places and face different costs. GDP is not designed to tell the complete story of household welfare, working conditions or access to services.
Even GDP per person is not a statement of the wage received by a typical employee. Dividing a national aggregate by the population produces an average measure of output, not an account of how income is distributed. Confusing the two can distort assumptions about what customers are able or willing to spend.
Suppose the restaurant’s expansion depends on attracting local families rather than corporate guests. The owner would need to understand those households’ budgets, preferences and competing expenses. Strong production growth elsewhere in the economy cannot establish how often those families will choose to dine out.
The same reasoning is useful to students and citizens reading economic news. A growth announcement answers a question about production. Questions about living standards, affordability or public-service delivery require additional evidence rather than an argument over whether the GDP figure alone proves success or failure.
The difference also helps readers place practical business Guides in context. The registration roadmap explains how to establish a business through the relevant processes; it does not establish the commercial demand for that business. A restaurant can complete those tasks correctly while its owners are still testing the case for additional tables. Understanding the economy supports the opportunity assessment, while registration supports a different decision about the enterprise’s formal establishment. Neither should be presented as evidence that the other question has already been settled.
From national context to a business decision
The restaurant owner can now return to the proposed expansion with a more useful interpretation. National growth suggests that the economic environment is changing, but the investment still depends on a particular group of customers choosing a particular service. More seats create capacity; they do not create demand by themselves.
The partner’s enthusiasm therefore becomes a hypothesis worth examining. Perhaps additional visitors will support lunchtime trade, or nearby offices will change weekday demand. Alternatively, more competitors may enter the same market, meaning that a growing customer base must be shared among more restaurants.
This way of reading GDP avoids both exaggerated optimism and unnecessary dismissal. The measure remains an essential description of the wider economy, while the business retains responsibility for understanding its own market. A good national story and a good investment case can reinforce each other, but they are not interchangeable.
The next explainer follows another headline that is often misunderstood at the dining table and in the boardroom: inflation. Understanding why slower price growth can coexist with expensive shopping and supplier bills adds another necessary part to the economic picture.