

Drone photograph from Invest Guyana’s media archive; contextual image, not the hypothetical project described.
Imagine a shop owner hearing that inflation has slowed while unpacking a delivery that costs more than the same order did a year earlier. At home, the grocery bill also remains uncomfortable. The headline seems to describe an improvement that neither the business nor the household can see.
There need not be a contradiction. Slower inflation usually means that prices are rising less quickly, not that they have returned to an earlier level. The distinction is simple once explained, but it changes how people interpret economic news, wage discussions and the cost of running a business.
For readers in Guyana, there is another important question: which prices does the reported measure cover? A consumer index describes a selected basket and population, while an individual household or enterprise pays for its own particular combination of goods and services.
The speed of change and the level reached
Inflation describes a rate of change in prices over a specified period. The price level describes how high those prices are. They are connected, but a change in the first does not necessarily reverse the second. IMF explanation of inflation.
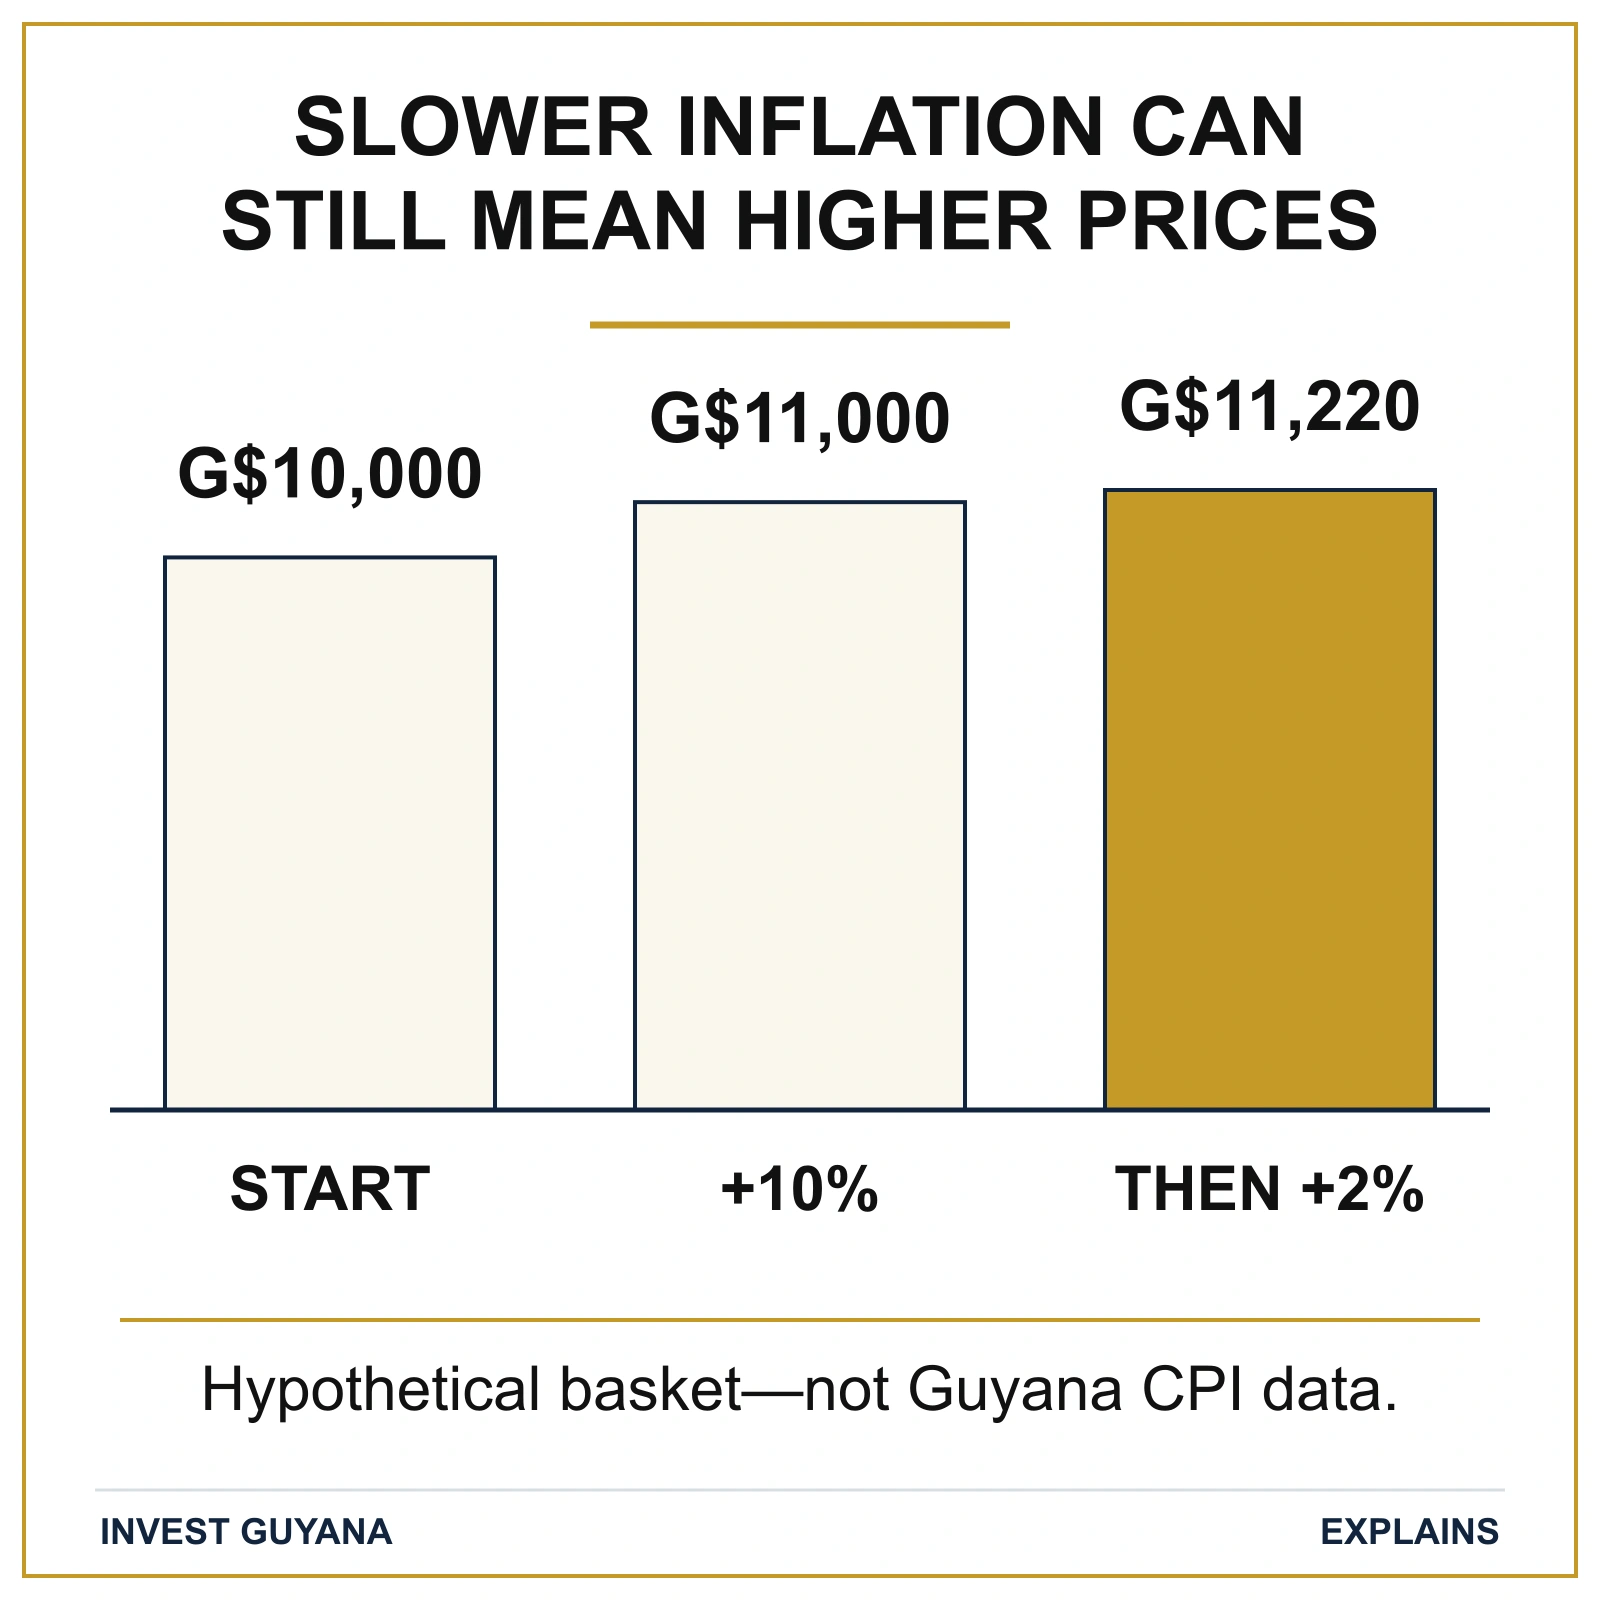
Consider a purely illustrative basket costing G$10,000. If its cost rises to G$11,000 over a year, inflation for that basket is 10%. If it then rises to G$11,220 over the following year, inflation has slowed to 2%, yet the basket still costs G$1,220 more than at the beginning.
Nothing in those figures says the second year was inexpensive. They say that the additional increase was smaller. To bring the basket back to its starting cost would require a fall in its price level, not merely a lower positive inflation rate.
This helps explain the shop owner’s frustration without dismissing the headline. The pressure can remain real even when the measured rate eases. A household adjusts to the accumulated cost of previous increases, while the latest statistic describes the change over its stated comparison period.
What a consumer price index represents
A consumer price index follows the cost of a selected basket of household goods and services. Different items carry different weights because they account for different shares of the spending represented by the index. A large movement in a lightly weighted item therefore has a different effect from the same movement in a major expense.
Guyana’s Bureau of Statistics describes regular price collection across retail outlets and publishes information on its price-index methodology. Its current publications include separate Georgetown and All Urban CPI series. The coverage of the chosen series should remain attached to any conclusion drawn from it. Bureau of Statistics price indices.
An index number itself is not a percentage increase for the latest year. It expresses the basket relative to a base period. To calculate a rate of change, one compares the relevant index values; reading the index level as the current inflation rate would confuse two different measures.
For our shop owner, the basket idea is more useful than imagining that statisticians simply average a few memorable price increases. The index has a defined construction. Understanding that construction explains why a product receiving considerable attention in conversation may have a limited effect on the overall result.
Why the comparison period matters
A monthly inflation figure compares prices with the preceding month. A year-on-year figure compares them with the same month a year earlier. Both can be correct at the same time, even if one looks almost flat while the other shows a more noticeable increase.
The Bureau’s Georgetown bulletin for July 2026 illustrates this difference by reporting monthly and twelve-month movements separately. Its accompanying component information also shows why an overall movement can conceal different experiences within the basket. The example is dated evidence of how to read a release, rather than a forecast of future prices. Georgetown CPI, July 2026.
Imagine that a particular expense rises sharply and then remains unchanged for several months. The monthly comparison may show little movement, while the annual comparison continues to include the earlier increase. When that earlier month eventually falls outside the annual comparison, the measured annual rate can change again.
This is why two headlines using different periods should not be compared as though they answer the same question. The reader needs the period, geography and series before deciding whether inflation has accelerated, eased or moved differently across categories.
Your basket is not everybody’s basket
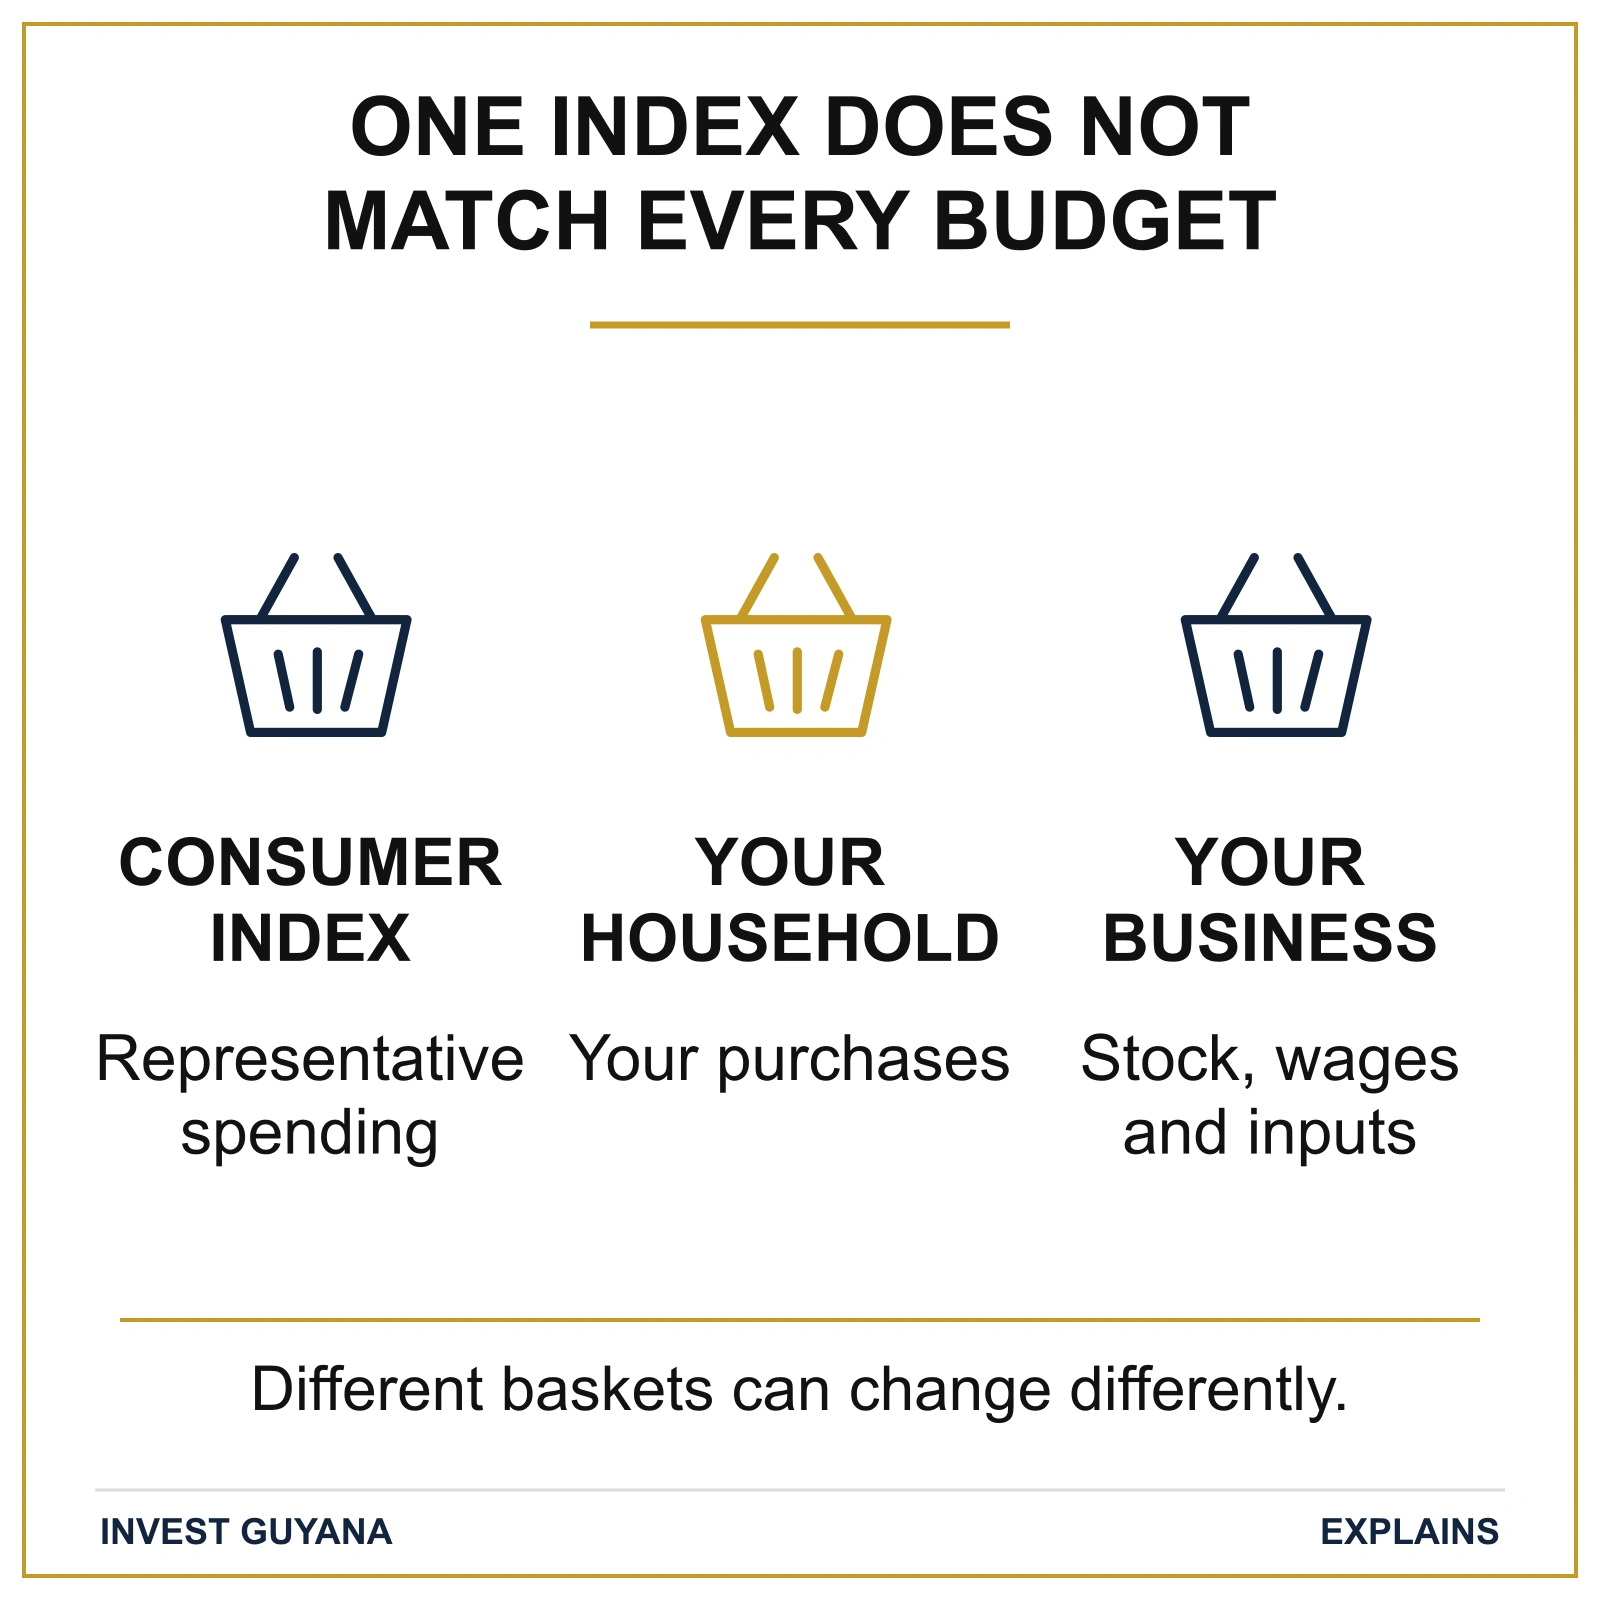
Two households may experience the same economy differently because they buy different things. One spends heavily on transport, another on food, and another faces a large change in a specific recurring expense. A representative index cannot reproduce every combination simultaneously.
The IMF’s analysis of inflation’s distributional effects explains how spending patterns influence the pressure experienced by different households. This does not invalidate a consumer index; it defines the limits of what an aggregate can tell an individual reader. IMF Fiscal Monitor, April 2023, chapter 2.
Our shop owner may remember the price of a frequently purchased item more vividly than a service bought only occasionally. Another household may hardly purchase that item at all. Both experiences are genuine, but neither alone describes the entire basket represented by the official statistic.
Geography adds another reason for care. A Georgetown series should not be casually relabelled as the precise experience of every community in Guyana. Nor should values from a different series be joined to it to create a longer trend without accounting for differences in coverage and method.
A business has a different cost structure
The shop’s accounts contain stock purchases, rent, wages, transport, finance costs and other expenses in proportions unlike a household’s budget. A consumer price index is therefore not automatically an index of the shop’s operating costs. It can provide economic context without explaining every supplier invoice.
Suppose the business relies on one imported product whose landed cost changes sharply. That movement may dominate the owner’s immediate cash needs even if the wider consumer basket changes modestly. Another enterprise using mostly local services may face a different pattern of pressure.
This distinction matters when discussing selling prices. A business needs to understand what has changed in its own costs, how much of that change affects each product and what customers will accept. The national inflation rate does not mechanically determine the appropriate price of every item on a shelf.
It also matters for planning. A budget that simply raises every expense by the same headline percentage may miss the costs that matter most to the enterprise. The useful lesson is conceptual: a broad measure and a specific operating model answer related but different questions.
Purchasing power depends on income as well
Whether a household feels better off depends partly on how its income changes relative to the prices it pays. A slower rate of inflation can still erode purchasing power when income is unchanged. Conversely, income growth may help absorb price increases, although the effect depends on the household’s actual circumstances.
For example, a worker receiving the same money income after the illustrative basket rises from G$10,000 to G$11,220 cannot buy as many of those baskets. The fact that the second annual increase was only 2% does not restore the purchasing power lost in the first year.
The shop owner faces a similar relationship between sales receipts and the costs those receipts must cover. Higher nominal revenue can coexist with a tighter margin or greater cash pressure. Understanding price changes therefore requires attention to both sides of the budget, rather than treating a larger money figure as an automatic improvement.
For an employer, these distinctions also keep wage discussions separate from payroll administration. A decision about pay concerns the business, its workforce and the applicable employment arrangements; calculating deductions and remittances is a different task. The existing PAYE Guide and NIS contribution Guide address those operational obligations. Neither turns a consumer-price percentage into an automatic wage rule, and this article does not recommend a particular adjustment to anyone’s pay.
Reading the next inflation headline
The owner can now interpret the next announcement more precisely. Slower inflation may represent less additional pressure, but it does not promise lower bills. The chosen index describes a particular basket over a particular period, while the business and household still need to understand their own spending patterns.
That is a more useful conclusion than deciding either that the statistics are meaningless or that personal experience must be wrong. The official measure and the individual budget can be describing different aspects of the same economy.
For businesses buying from overseas, part of the cost story may also involve the currency used to pay suppliers. The next article examines exchange rates, explaining why the amount on a foreign-currency invoice and the Guyana-dollar amount needed to settle it are different quantities.